Maintaining a competitive edge requires constant monitoring of all data that is available to you in order to find bottlenecks and boost productivity as accurate and real-time data analysis is essential for optimizing production processes and ensuring smooth operations. Yet, compiling these reports and extracting the desired information from the vast sea of data may not be as easy as it sounds.
At SCW.AI, we understand the critical role data plays in enhancing efficiency, reducing downtime, and ultimately, maximizing overall equipment effectiveness (OEE). If you own our Digital Factory platform, you should already have an edge on the collection of detailed system reports that assist you in enhancing your operations, but what if you wanted to generate reports that you can customize and see instant results?
Then look no further than our Configurable Custom Report Generation feature of the My Reports section for our OEE Tracker! This important addition to Digital Factory empowers customers by enabling them to access, analyze, and create custom reports, providing valuable insights into their production lines like never before.
With this feature, you become the curator of insights as you generate your desired trend reports with customizable metrics and charts.
Tailored Insights for Unique Requirements
The manufacturing industry is no stranger to the importance of data-driven decision-making. However, with the growing complexity of manufacturing processes, capturing, managing, and interpreting production data can be a challenging task. My Reports is the result of our commitment to simplify this process and provide our customers with a user-friendly, intuitive tool to harness the power of their data. With our My Reports function our clients can effortlessly customize the data they wish to visualize and analyze. Whether it’s production rates, equipment downtime or OEE values, Digital Factory allows users to select, filter, and organize data based on their requirements.
My Reports also enables clients to view historical data and trends over time, facilitating in-depth analysis of production line performance. By identifying patterns and areas of concern, pharmaceutical companies can implement targeted improvement strategies and stay ahead of the competition. Our My Report feature users gain access to powerful insights at their fingertips, allowing them to address challenges promptly, minimize production disruptions, and drive operational efficiency.
How to Create Your Custom Report for Discovering New Insights?
Creating a custom report with My Report feature is a seamless process. It all starts with the freedom to select the date range that matters most – whether it’s a quick overview of the current week, a comparative analysis of the last month, or a granular exploration from a specific date to another.
The next step is selecting the breakdown. Breakdowns are a crucial element in comprehending data trends. With My Report, users can easily choose from hourly, daily, weekly, and monthly breakdowns. This feature ensures that your insights are as detailed or as broad as you desire. Whether you’re identifying patterns in the daily workflow or tracking the overall monthly production progress, the choice is yours.
Then there is the site selection for your report. Here, users can simply select their site they want to view the report for and move on to the next step, which are the production lines.
My Report provides users with the ability to handpick the production lines they wish to focus on. Whether it’s analyzing all lines collectively or delving deep into the specifics of a few, this function delivers the data that matters most to your operations.
The value of My Report unfolds when users dive into metrics that are pivotal for production success. This feature allows users to select from three dynamic metric categories, each offering unique insights:
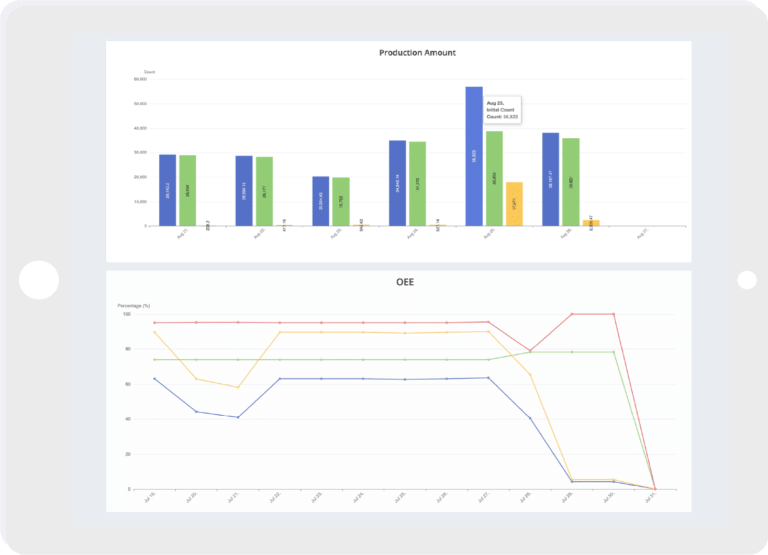
- Production Amount: Production is the cornerstone of any manufacturing process. In this metric, users can easily track the production journey. Choices like initial, good, and scrap production counts allow you to understand your line’s efficiency and quality. The flexibility of selecting one, two, or all three metrics empowers users to tailor their reports to match their specific objectives. And the visualization options – Bar, Stacked Bar, or Line – add an extra layer of clarity to your data interpretation.
- Activity: Planned and unplanned downtimes are critical factors that can greatly impact productivity. The Activity metrics category displays the activities happening on your production lines. Whether it’s machine failures, resource issues, or changeovers (setup and cleanup), this feature helps you pinpoint where optimizations are needed. With visualization options that include Bar, Stacked Bar, or Line, your data comes to life, revealing areas for potential improvement.
- Productivity: At the heart of production lies the concept of productivity. The Productivity metrics section allows users to see the Overall Equipment Efficiency (OEE) of their selected production lines over the specified date range. And that’s not all – users can explore Availability, Performance, and Quality metrics individually for a comprehensive understanding. Again, the ability to visualize these insights in Bar, Stacked Bar, or Line formats transforms data into strategic action.
Conclusion
In the manufacturing industry, where precision and efficiency are of utmost importance, data-driven decision-making can be a game-changer. With My Reports, SCW.AI empowers manufacturers to take charge of their production processes. By providing real-time data visualization, customizable dashboards, and trend analysis, we are enabling our clients to maximize productivity, optimize OEE, and drive continuous improvement.
Are you ready to build your own reports that will set you apart from the rest and see correlations that simply aren’t visible in the standard reports? We can assist you in finding your way through. Book A Demo to explore My Reports and find out more about Digital Factory Platform
To get more information regarding how we can generate custom reports for you besides the generic reports of Digital Factory you can contact us.
