OEE (Overall Equipment Effectiveness) is a widely used concept in digital manufacturing. It is a powerful measurement system, or a KPI (Key Performance Indicator), that gives detailed information to spot and solve problems in manufacturing and operations. When calculated and interpreted correctly, OEE can be used to determine what percentage of production time is truly productive.
In this series of articles, we will start by explaining the basic concepts like availability, performance and quality together with the principles of Six Big Losses like changeover, microstop, etc.
After the basic concepts are well understood, we will continue with clarifying OEE calculation and factors and parameters that need to be included in it. Although the term OEE is commonly used, in most cases, it is not well understood exactly how the calculation is made.
With the thorough understanding of fundamental concepts of OEE, towards the end of the article, we will demonstrate how a manufacturing company can utilize the concept of OEE and benefit from it. This part will contain analysis, examples and statistics which will be helpful to understand the essentials before implementing OEE systems in a factory.
Concepts and Principles of OEE
Although there is a generally accepted definition of OEE, it is very important to note that the basic concepts and principles should be well understood and defined. Only then can OEE serve as an effective KPI and benchmarking tool.
We can represent the general idea of OEE as follows:
OEE → Availability, Performance, Quality

Now, let’s focus on these three concepts and the points to be considered during calculation in detail:
Availability
Before talking about Availability factor, we need to define the terms Idle Time and Planned Production Time. Idle Time (sometimes referred to as Schedule Loss) is the time a line or a machine is not in operation due to reasons like no shifts, shutdowns, holidays, etc. Idle time is assumed not to be optimized and therefore is not included in OEE calculations.
Planned Production Time is the time left when we extract the Idle Time from all available time (7/24). OEE calculation starts with Planned Production Time and the whole concept of OEE is based on the idea of how effectively Planned Production Time is used to manufacture good-quality products.
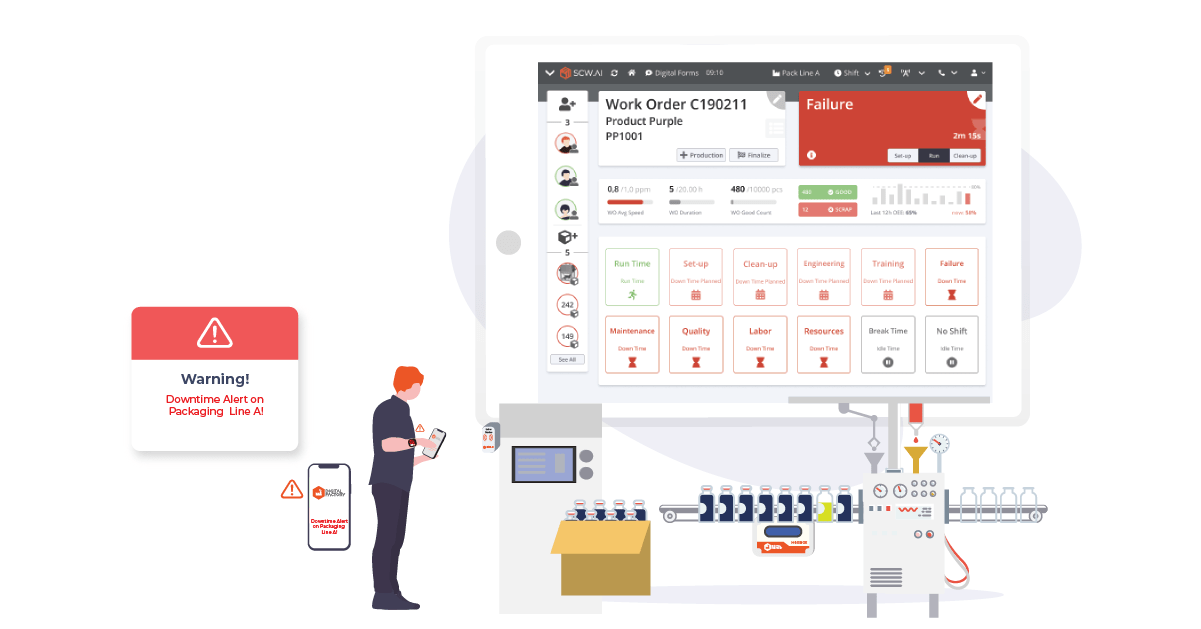
Availability factor takes into account all the activities that interrupt Planned Production for a significant period of time. These activities are called Downtime. Planned and Unplanned Downtime may occur for many reasons:
- Equipment failure or malfunction
- Material shortage
- Overall System Failure (power outage, etc.)
- Inactive times (shift change, etc.)
- Maintenance
The time left after the Downtime is simply called Production Time.
Performance
The performance metric of OEE is about reduced production speed due to a variety of reasons. Some important issues that bring about the low performance may be microstops, operators being inefficient, material problems and equipment deficiencies. When we subtract the loss related to performance factor from the Production Time, the remaining time is called Net Production Time.
The performance factor of OEE can also be calculated by dividing the actual production count within a given interval by the target count aimed to be produced. The target count for a given interval is defined by the related personnel (supervisor, planner). Determining a logical, stable and well planned target count for production is one of the key parts of OEE calculation.
Quality
As the name implies, the Quality factor of OEE measures whether the products being produced are acceptable and at the desired level in terms of the defined standards. In a production where scrap count is high, quality rate decreases at the same rate.
OEE Calculation – An Example
Let’s reflect these concepts on an example:
A work order with an ordered quantity of 18 products is planned to run. Let’s take the target speed as 9 products per hour. So, ideally, we can produce 9 products in an hour, which means we need 2 hours (120 minutes) in order to produce 18 products.
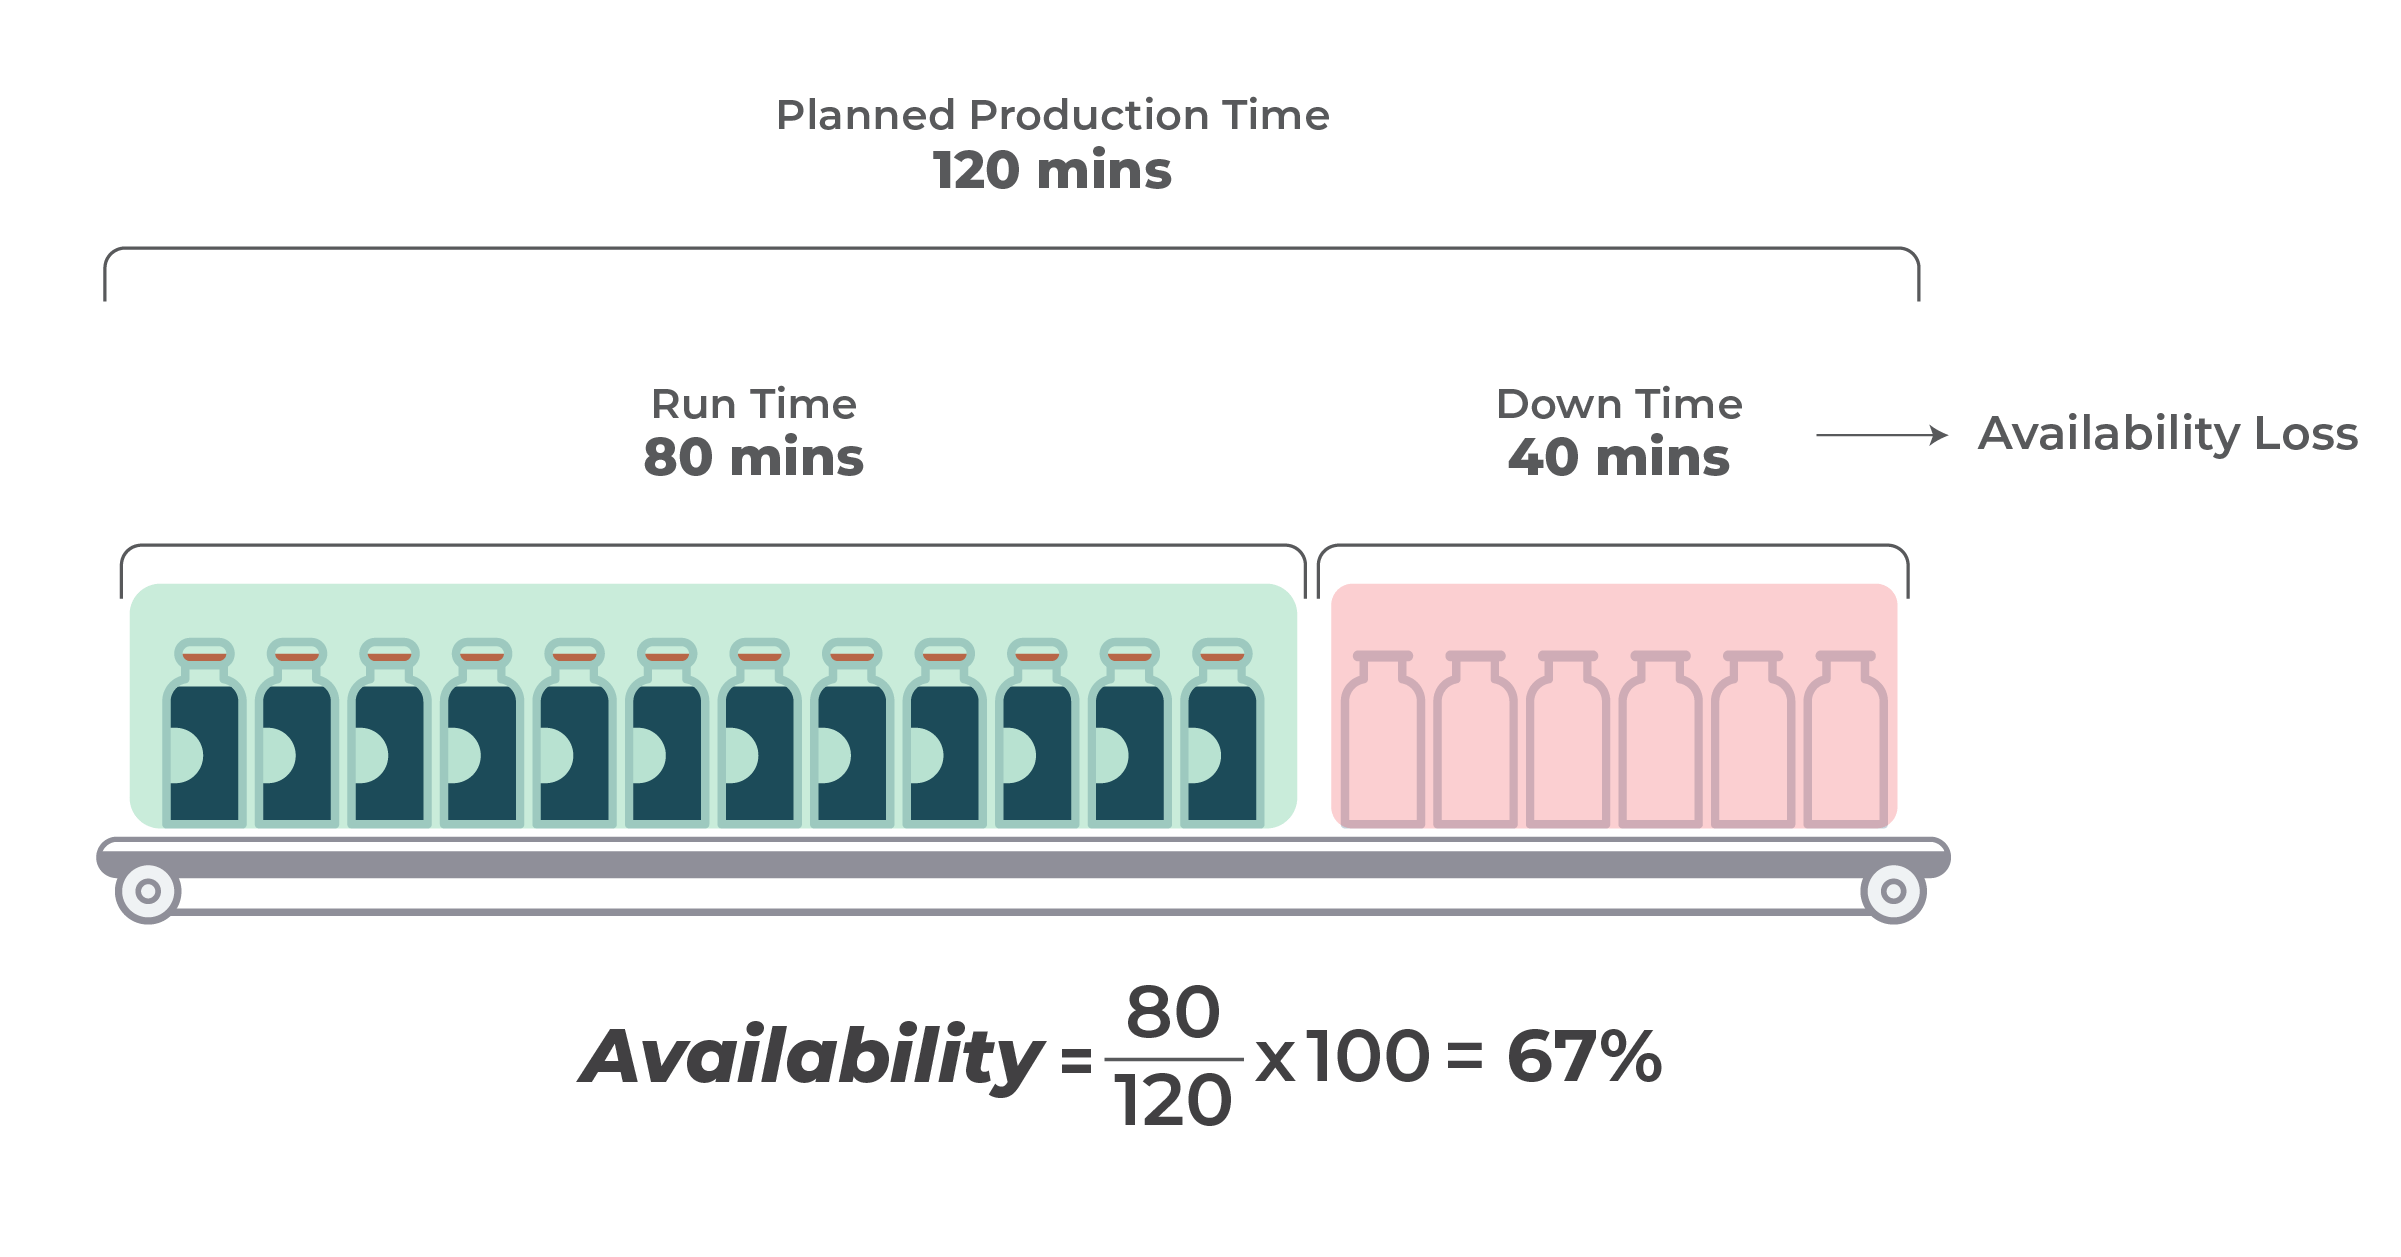
Availability Loss
For the sake of this example:
Let’s assume we needed 10 minutes of Setup and 10 minutes of Cleanup time in order to start the production on the line. On top of that, due to an Equipment Failure, we were not able to run the line for 20 minutes.
So, in total, we lost 40 minutes of time due to the line not being available.
Performance Losses
In this example, our target speed is 9 products per hour, but it is not always possible to continue production in accordance with the target speed. Slow speeds can be caused by many reasons:
- Equipment setup and configuration
- Worn down components or parts
- Operator’s lack of competence
- Momentary stops (micro stops)
Let’s assume that we lost 20 minutes because of Slowness and Micro Stops.

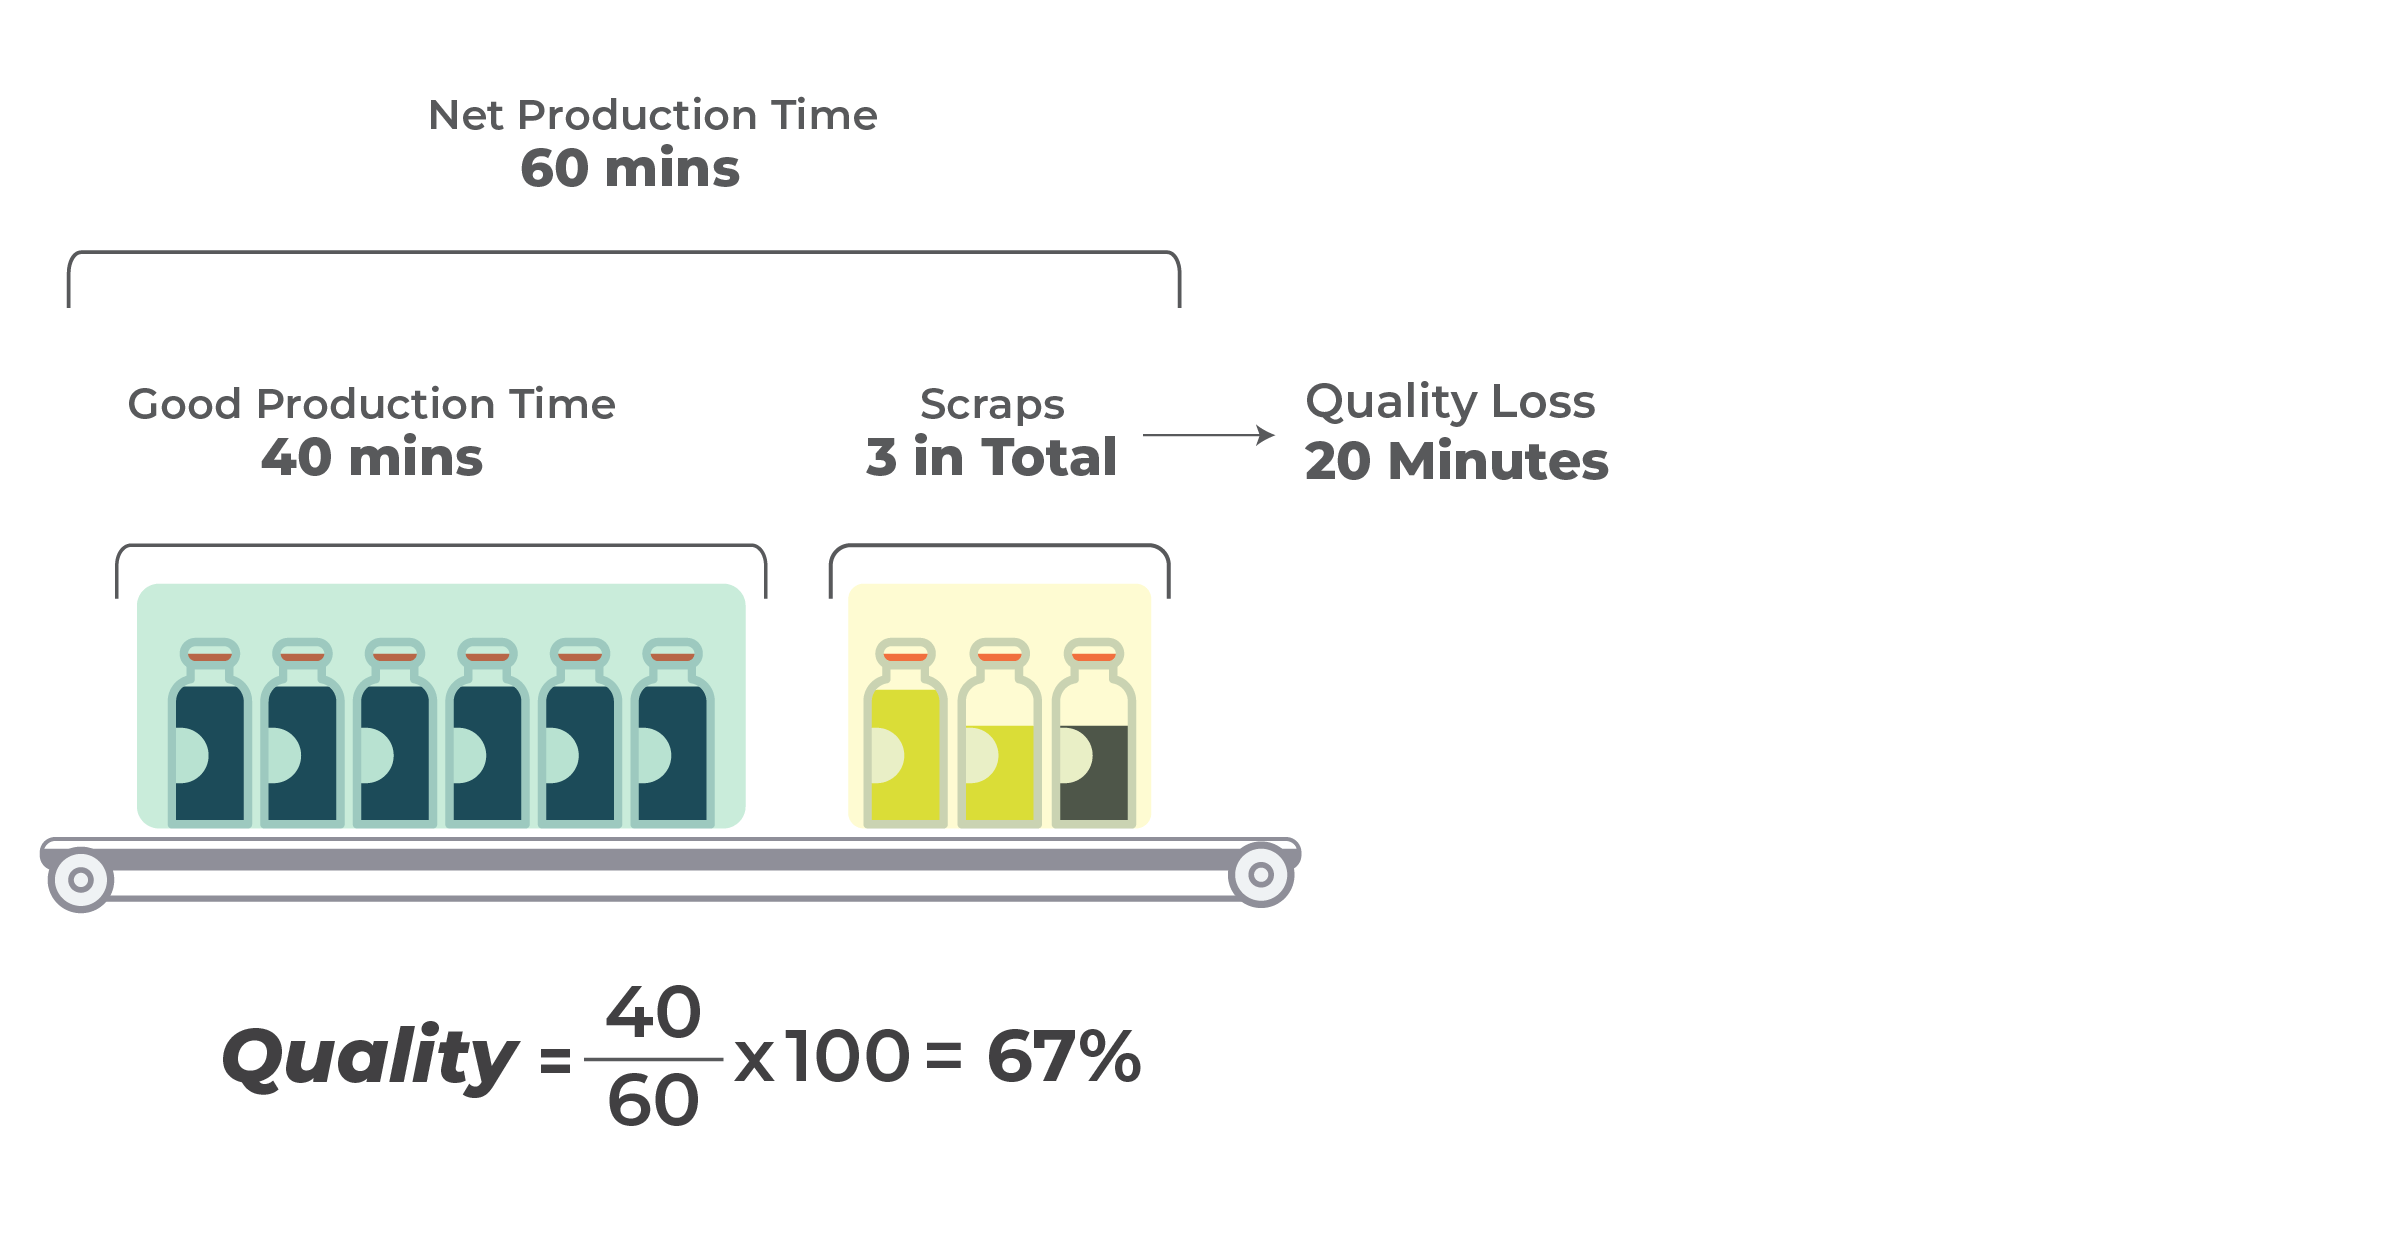
Quality Losses
Unfortunately, not all products coming out of a line can be used by customers. There will be some scraps that may need re-work or which may even need to be discarded.
For our example, let’s assume that we have 3 Scraps at the end of production. Since our calculations are time based, and we are trying to find “The Time Lost due to Quality Issues”, we can calculate how much time we spend while producing these scraps.
Our target speed is 9 products per hour (60 minutes). Thus, it would take 20 minutes to produce 3 products. In other words, we lost 20 minutes of our production time due to quality problems.
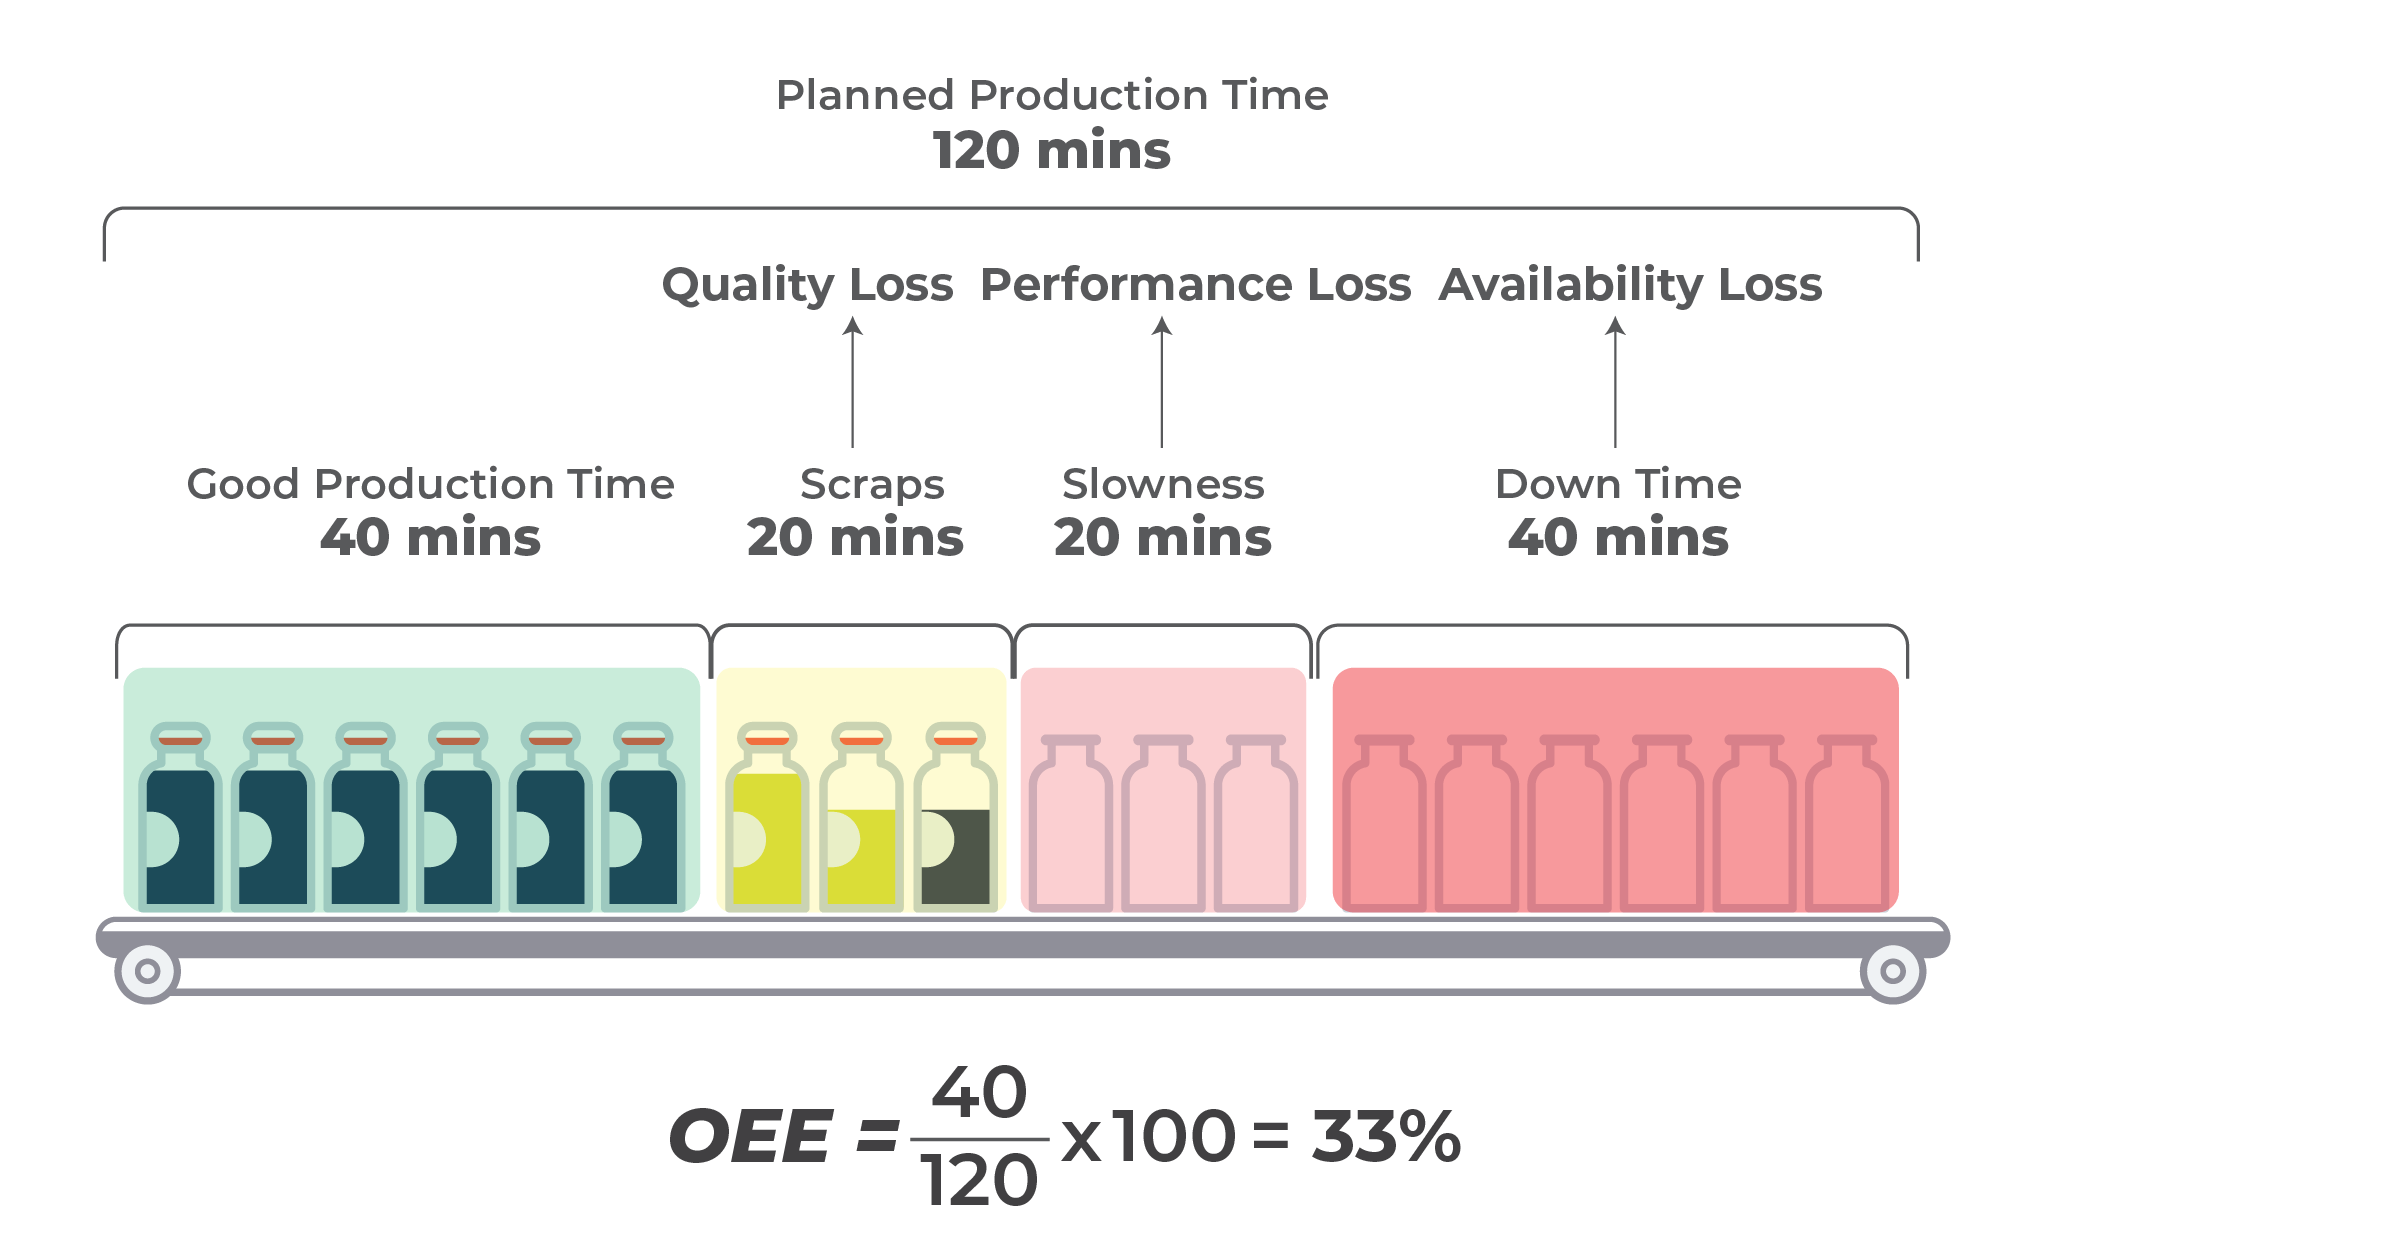
All Losses Combined
In an ideal world, we would complete our work order of 18 products in 2 hours. In other words, our work order size would be “2 ideal hours”. However as demonstrated above, losses happen and we end up with 6 good products which is equivalent to “40 ideal minutes”. See the illustration below.
How to use OEE?
Using a well-proven OEE solution is an essential factor in meeting your production goals. Tracking OEE enables you to monitor production processes in real time, reduce downtime, increase capacity, reduce costs, and take a proactive approach by increasing quality and efficiency.
- ROI (Return of Investment) Optimization: Manufacturers invest heavily in production lines, equipment and resources. Thus, it is important to maximize the return on this investment. If you use an OEE strategy to produce more products with the same equipment and resources in the same amount of time, it will have a huge impact on ROI.
- Increase Competitiveness: Manufacturers try to reduce production losses in order to achieve maximum competitiveness. Using data from an OEE report helps them identify bottlenecks or weaknesses in production, enabling them to take immediate action. Quality and competition go hand in hand, and OEE’s quality benchmark also helps you identify issues in production that cause scrap or rework.
- Reduce Machine Costs: An OEE solution allows you to understand the true performance and efficiency of your equipment. It also alerts you to problems that could lead to future malfunctions and repairs. OEE allows you to predict potential machine failures, reducing maintenance costs and downtime.
- Maximize Resource Productivity: Use OEE to uncover productivity data and identify long cleanup, setup and startup times. Information like this helps you allocate resources appropriately, identify where excess capacity is occurring, and identify where you need new resources.
- Easily Visualize Performance: Tracking OEE allows you to visualize production issues rather than relying on your best guess. By making the data visible, OEE highlights the causes of productivity loss in detail, showing what is working and where improvement is needed.
In our article, World Class OEE in Pharma: A Benchmarking Analysis, learn about the average OEE performance of pharmaceutical firms and find ideas for improvement.
Are you interested in a cloud solution that collects your shop-floor data and calculates your OEE?
OEE Tracker can help you to improve line efficiency via live performance tracking and advanced analytics!
Book a demo now to explore!