
McKinsey reports that the pharmaceutical industry is witnessing a rise in demand for some drug types. For instance, it is expected that by 2028, revenue from sterile manufacturing would increase by more than 40%. Encouragingly for pharmaceutical manufacturers, there is an opportunity to meet the demand without the need for new factories or substantial capital investments—simply by enhancing efficiency.
Our benchmark analysis of Overall Equipment Effectiveness (OEE) in the pharmaceutical industry reveals that the current industry average for OEE is slightly above 35%, indicating ineffective resource utilization. Additionally, we have identified an efficiency gap between effectively digitized and average pharmaceutical factories, with digital facilities boasting 1.75 times higher OEE that indicates up to 60% throughput with no capital investment.
This article offers pharmaceutical managers a comprehensive overview of OEE and its pivotal role in manufacturing. Subsequently, we will demonstrate the OEE disparity between digitized and average pharmaceutical factories, offering data-driven best practices for pharmaceutical manufacturers seeking to elevate their availability, performance and quality. Following that, we will reveal the benchmark for world-class OEE within the pharmaceutical industry, drawing insights from the top 10% quartile. Concluding the article, we will elaborate on how SCW.AI can provide support for your journey towards becoming a top-quartile pharmaceutical producer.
If you would like a deeper dive into OEE in pharma beyond benchmarking—including detailed calculation methods, ROI modeling, real-world case studies, and practical strategies to improve availability, performance, and quality—you can download the free PDF document: The Pharma Manufacturer’s Complete OEE Handbook: Calculations, Benchmarks, & Improvement Strategies.
What is OEE?
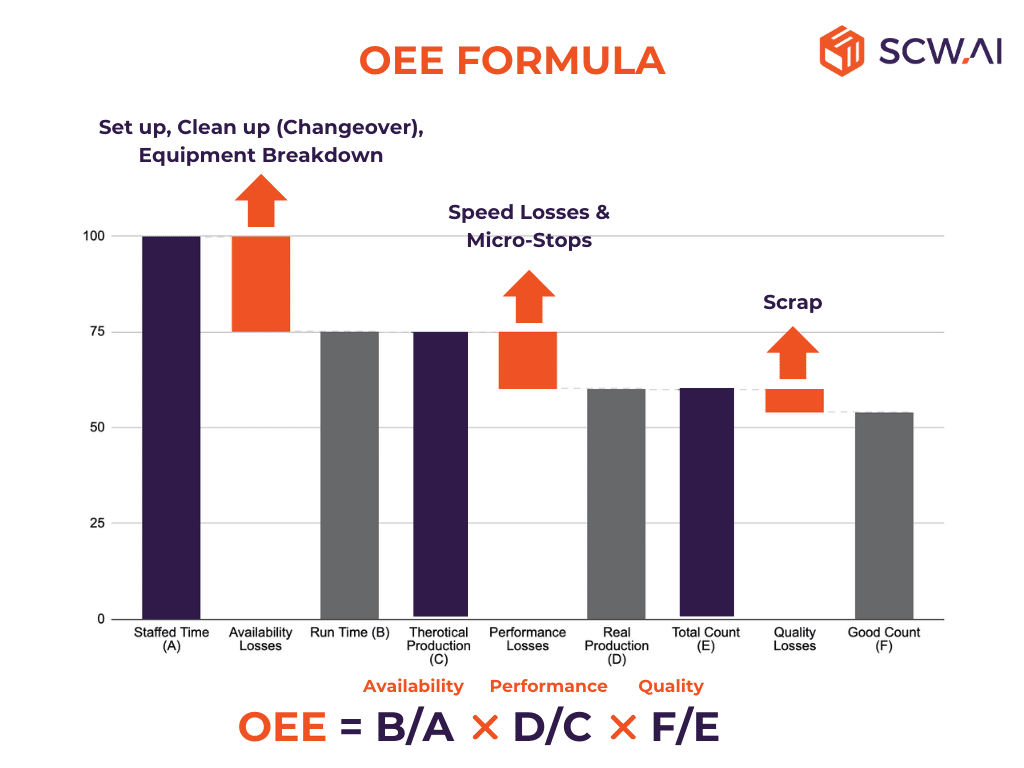
OEE (Overall Equipment Effectiveness) is a production KPI that shows how well a manufacturer uses its resources (see image above). It provides a value between 0% and 100%, with a higher value indicating a more effective utilization of resources. Focusing on three crucial components—namely, availability, performance, and quality—this approach provides granular insights into productivity.:
- Availability: Availability is determined by subtracting both unplanned and planned downtime from the staffed time, providing a clear understanding of the scheduled operational duration for a specific production line. Essential activities like cleaning lines and setting up equipment for production (changeover time) need to be deducted from staffed time. Beyond planned losses, unplanned losses such as machine and equipment failures must also be subtracted from the overall scheduled time.
- Performance: A distinction exists between runtime and net runtime, primarily attributed to performance losses like micro-stops and speed losses, which may signal underlying equipment performance issues. By subtracting these performance losses, a manufacturer can determine the net runtime of the production lines.
- Quality: After deducting scrap products from total count, manufacturers can find their real productive time.
To find out methods for calculating OEE you can read our A Simplified Guide to OEE Calculation: Methods and Examples article.
To find details information on 60+ manufacturing KPIs including their formulas and use cases, you can download our Manufacturing KPIs Handbook for Mangers and Executives now!
What is a Typical OEE Score for Pharmaceutical Manufacturers?

Based on our OEE benchmarking, a pharmaceutical manufacturer with minimal digitization typically achieves an OEE score of approximately 37% (McKinsey’s 2021 analysis revealed that the industry average stands at 35.). This score falls significantly below their average target of 60%, suggesting that pharmaceutical companies are missing out on potential financial gains.
To put it into perspective, if the industry were to attain an average OEE of 60%, this could result in an 20% to 60% increase in throughput depending on how improved productivity is split between capacity and reduced labor expenses. Achieving 60% OEE also yield a yearly return of between $14-$16 million for a factory with 50 production lines and $50M initial revenue. (To find out which inputs we provide our ROI calculator for this estimation check “Appendix” Section.)
Exploring the detailed breakdown of losses within a typical pharmaceutical manufacturing process can provide readers with deeper insights:
1. Availability
The availability score of an average pharmaceutical manufacturer is below 50%, highlighting substantial losses within the industry. This underscores the critical need for prioritizing improvement in this area to enhance overall productivity. To identify bottlenecks within pharmaceutical companies, a closer examination of availability data at a more granular level is essential:
1.1 Planned Losses
An average pharmaceutical company dedicates more than 30% of staffed time to planned losses, such as cleaning, which accounts for 60% of availability losses. In an industry as rigorously regulated as pharmaceuticals, prioritizing patient safety is crucial; however, dedicating 31% of staffed time to these planned activities appears inefficient when contrasted with the practices of Pharma 4.0 companies. Strategies to reduce changeover time with practices, such as increasing the frequency of minor changeovers via AI-driven schedulers (APS systems), can be implemented to enhance efficiency. To find out how you can reduce changeover time you can read our Changeover Analysis: Boost Profits by Minimizing Downtime article.
1.2 Unplanned Losses
An average pharmaceutical manufacturer experiences a 20% loss of staffed time due to unplanned events like machine breakdowns. The data underscores the industry-wide issue of unreliable equipment, emphasizing the urgent need for enhanced maintenance practices. Implementing maintenance performance analysis, AI-driven predictive maintenance and leveraging digital twin-supported virtual inspections are pivotal steps toward improving the reliability and performance of machinery.
You can read our Top 5 AI Use Cases in Manufacturing article to find detailed information regarding AI applications in manufacturing.
2. Performance
The performance score for a typical pharmaceutical manufacturer is around 80%. Data reveals that equipment-related issues contribute to performance losses in the form of speed losses, however, the major reason for the performance losses is micro-stops. Micro-stops often arise as chronic problems with the same root cause triggering the issue repeatedly. To address this, manufacturers require technological tools that facilitate automated production tracking, such as OEE Dashboards enabling a more proactive approach to resolving persistent challenges.
3. Quality
The quality score for a typical pharmaceutical manufacturer stands at approximately 94%, implying that an average pharmaceutical company experiences a 6% loss of goods as scrap. However, given the industry’s meticulous commitment to drug quality, even a 6% loss in quality could result in warning letters from the FDA or even product recalls if companies do not vigilantly monitor and manage their scrap products. In addition new drug modalities like orphan medicines or ATMPs are very sensitive and negatively impacted by any deviations in quality. As a result, pharmaceutical companies must target 100% for quality.

If you are a European pharmaceutical producer aiming to close the productivity gap, we recommend downloading our recent eBook on the topic. Whether you are an essential medicine producer seeking to reduce costs or looking for complete standardization to scale the production of new drug modalities, you will find actionable solutions within.
OEE Benchmarking for Digitized Pharmaceutical Manufacturers

Based on our OEE benchmarking analysis within the pharmaceutical industry, companies that enhance factory visibility, productivity, and overall efficiency through Pharma 4.0 investments achieve an average OEE that is 1.75 times higher than the industry average, surpassing a score of 60. Here is the OEE breakdown of digitized manufacturers:
- Availability: Pharmaceutical manufacturers leveraging digital technologies exhibit an availability score of 67%, underscoring the positive impact of Industry 4.0 solutions on their lean activities. These companies make informed decisions that directly address the primary OEE loss factors within the pharmaceutical industry. Here is the breakdown of availability wastes:
- Planned Losses: In Pharma 4.0 factories, the planned loss of 22% of staffed time indicates a substantial reduction in changeover time.
- Unplanned Losses: In digital factories, unplanned losses, accounting for 11% of staffed time, signify an extended equipment lifespan.
- Performance: The performance score for Pharma 4.0 companies stands at approximately 93%, underscoring that digitization serves as a remedy for mitigating speed losses and minimizing micro-stops.
- Quality: The quality score for digital pharmaceutical factories is approximately 98%, signifying heightened productivity and a reduced likelihood of receiving warning letters and OTIF penalties in comparison to traditional factories.
What is a World Class OEE Score?
In Seiichi Nakajima’s 1984 book “Introduction to TPM,” a world-class OEE was defined as a score exceeding 85. However, achieving this ideal score can be challenging for pharmaceutical companies due to stringent regulations and high-quality expectations. According to Mckinsey, workers allocate up to 30% of their time for the meticulous documentation of logbooks and batch records. These records undergo audits by organizations such as the FDA to evaluate pharmaceutical companies’ compliance with cGMP standards. Due to the unique challenge of the industry, we aimed to calculate a world class OEE specifically for pharma as you will see below.
World Class OEE Score for Pharma
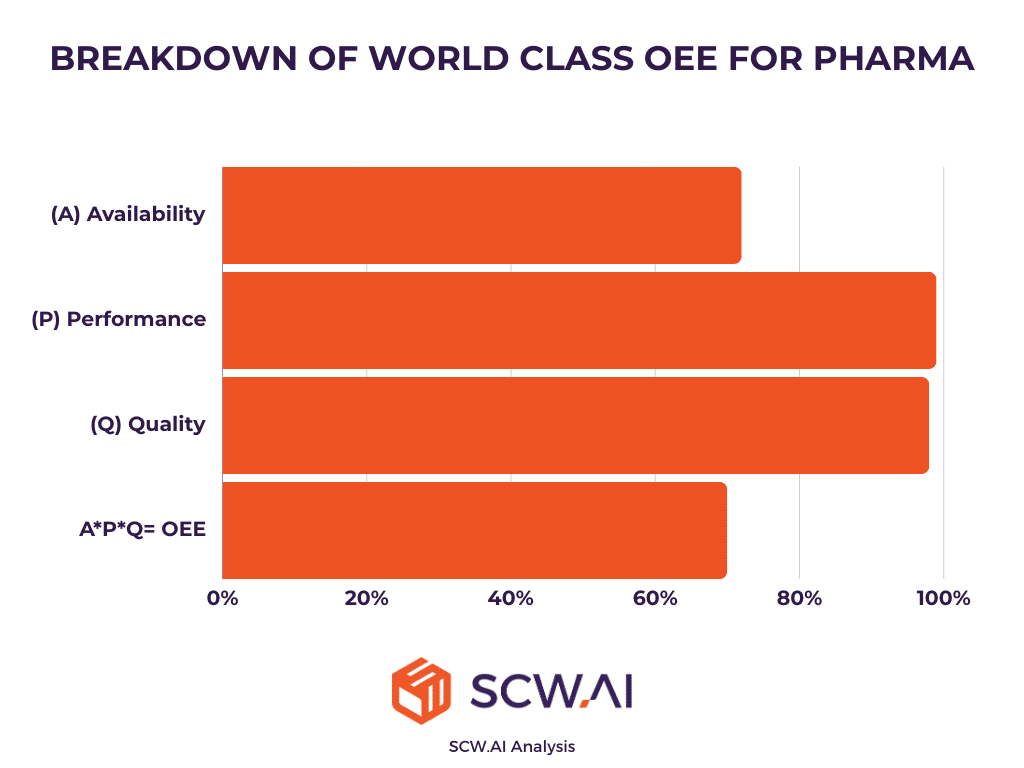
Our OEE benchmarking analysis indicates that the attainable world-class OEE for the pharmaceutical industry stands at approximately 70%. This determination is based on an evaluation of the top 10% quartile lines that consistently outperform others. In contrast to average digitized factories, world-class OEE lines exhibit shorter losses for planned activities. Additionally, performance losses are minimal (approaching 0%), signaling that these shop floors adeptly identify and rectify chronic issues related to both equipment performance and labor inefficiencies.
The near-zero rework and scrap rates achieved by top pharmaceutical manufacturers imply a first pass yield of almost 100%. Consequently, factory transformation is a necessity for pharmaceutical manufacturers pursuing world-class manufacturing or advanced quality management maturity.
Download Free Handbook on OEE in Pharma

For a more in-depth exploration of OEE in pharmaceutical manufacturing—including benchmarking data, ROI insights, and proven strategies for improvement—we invite you to download our free handbook:
The Pharma Manufacturer’s Complete OEE Handbook.
Have a World Class OEE with the Support of SCW.AI
SCW.AI’s Digital Factory Platform incorporates modules specifically designed to support pharmaceutical companies in enhancing resource effectiveness, ultimately aiding them in reaching the world-class OEE for Pharma:
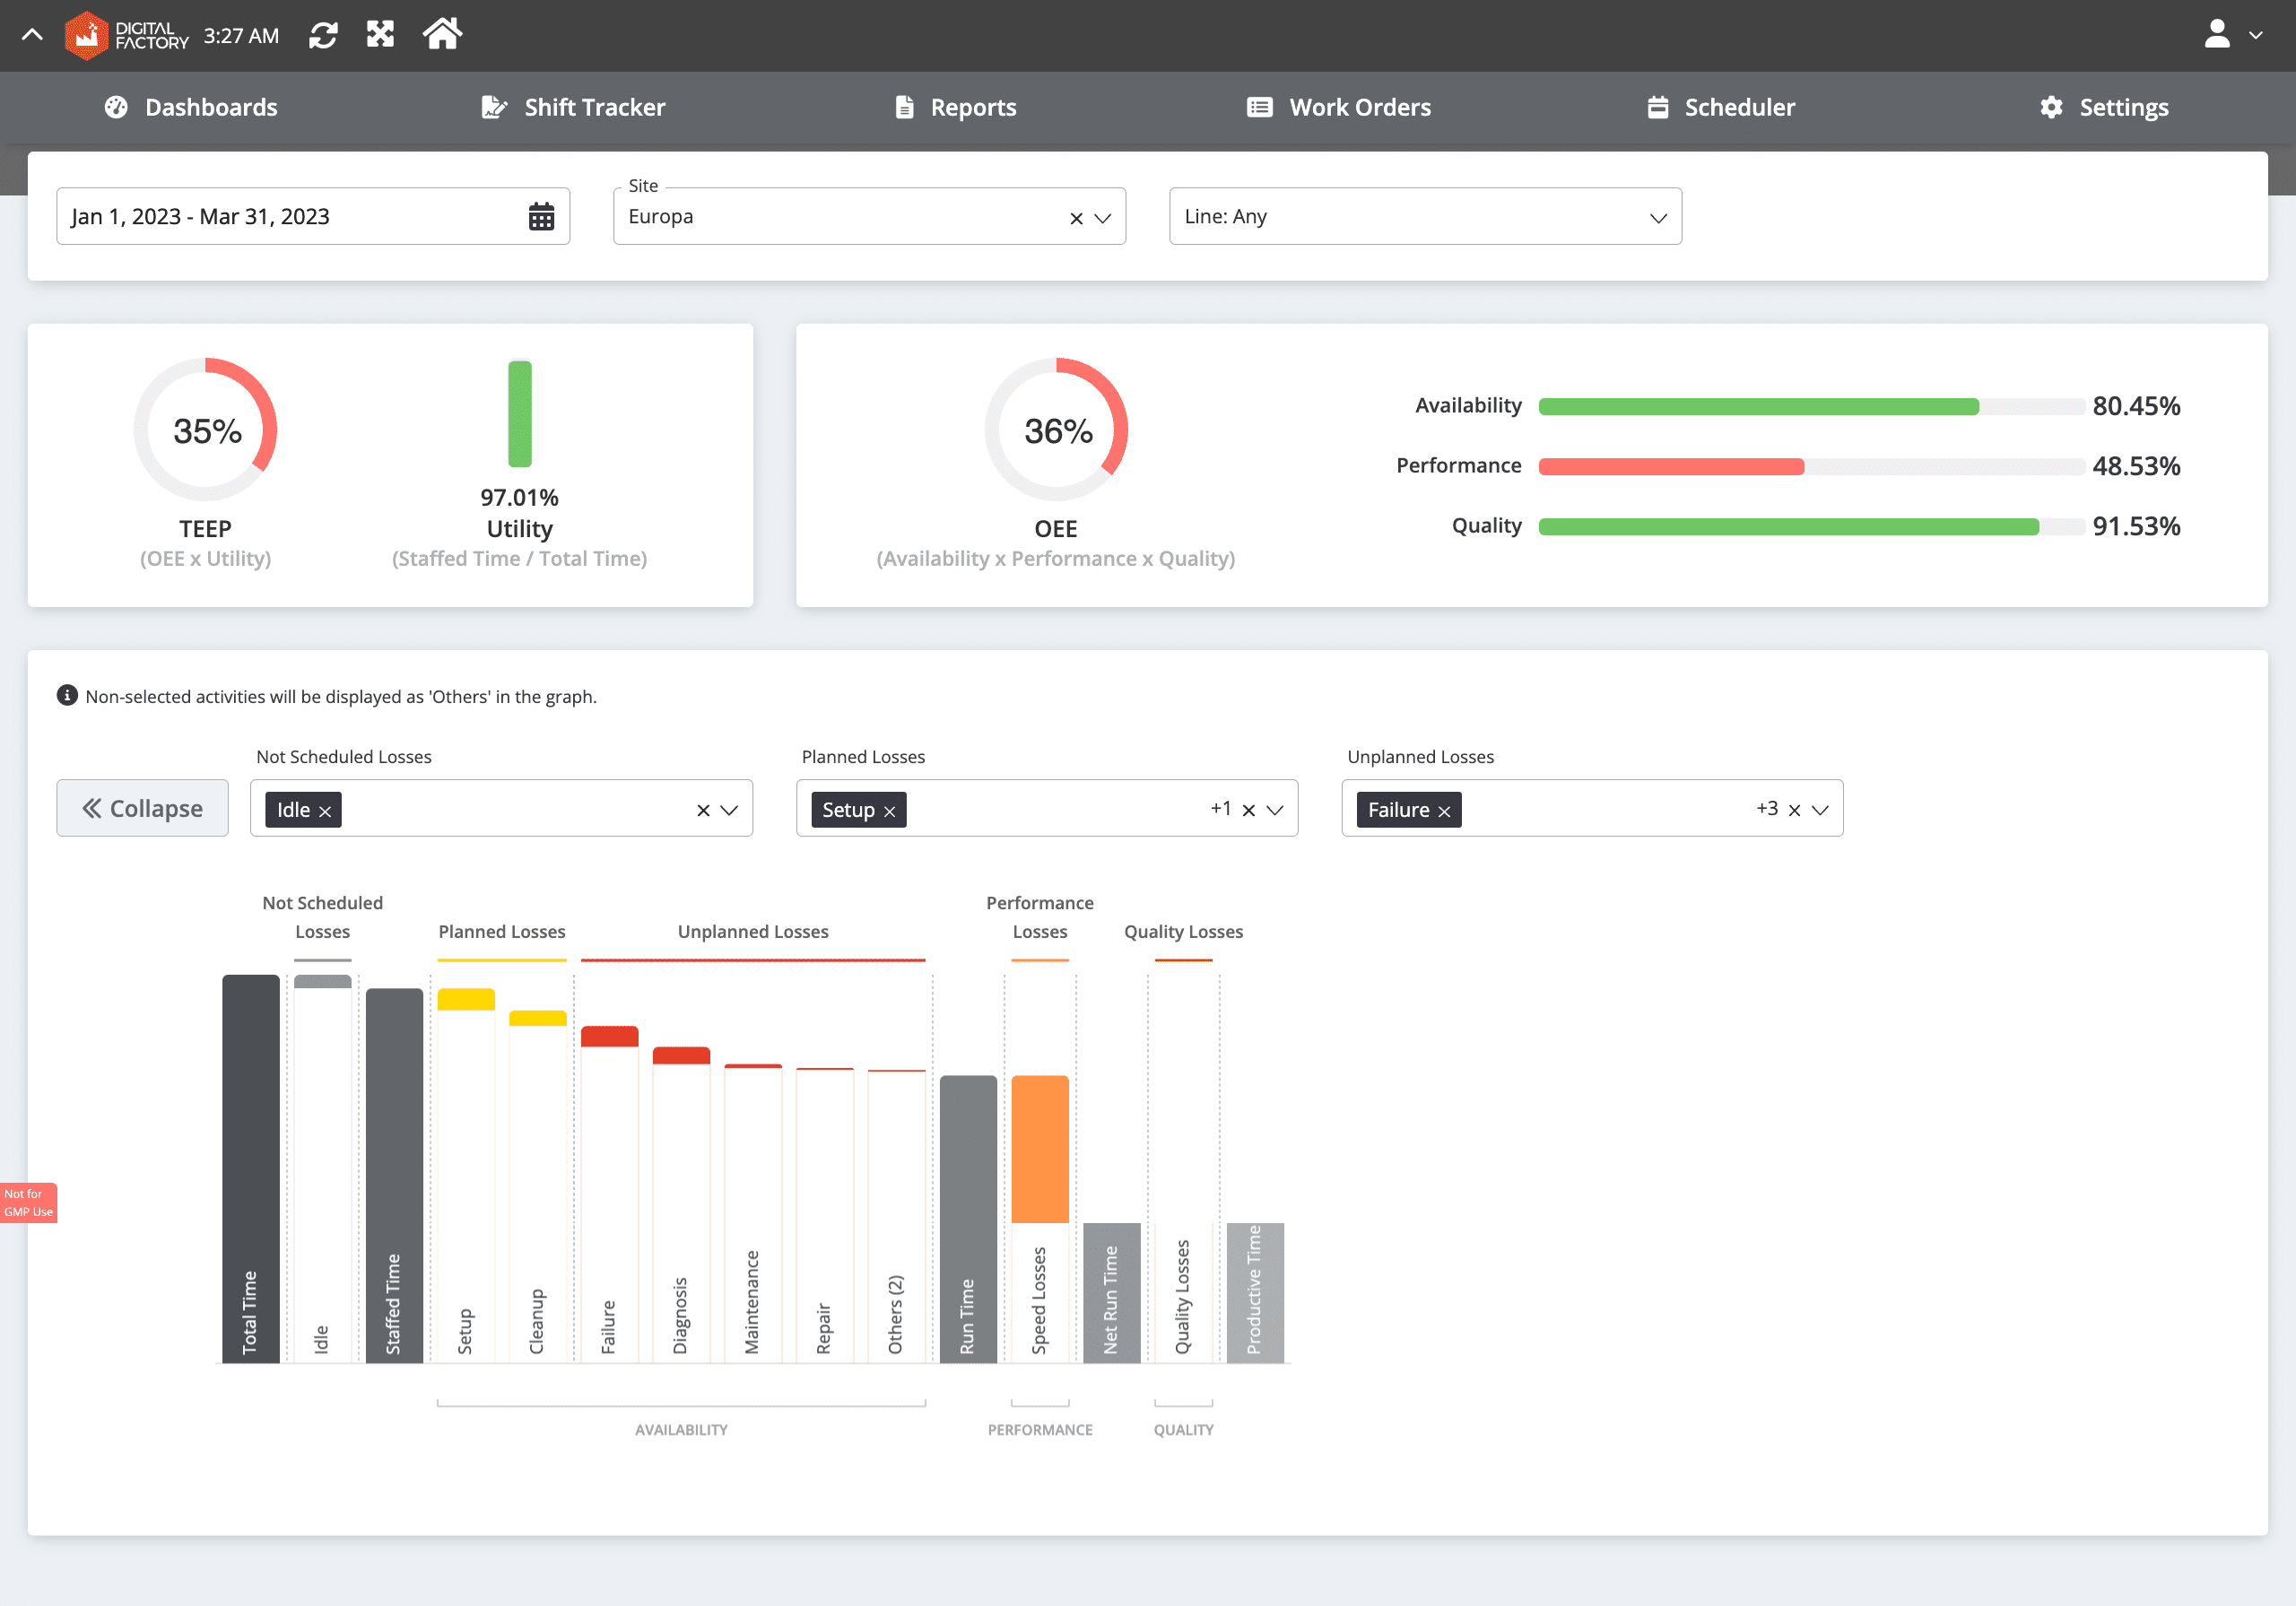
- OEE Tracker: Improving any metric requires a dedicated dashboard fueled by real-time data, offering granular, line-by-line information. The OEE Tracker precisely addresses this industry need through comprehensive reports, including the OEE Waterfall Analysis (as shown in the image above), Global View, Site View, Changeover Report, and numerous others.
- Labor Tracker: By utilizing this module, executives can efficiently assign the right operators to the right work orders and identify areas where staff may require training for specific issues, thereby ensuring a continuous improvement of their workforce capabilities.
- AI-Scheduler: Purposefully crafted to serve as an agile planning solution for various scheduling requirements within pharmaceutical companies, SCW.AI’s AI-driven Scheduler empowers organizations to strategically plan their manufacturing. Whether the goal is to achieve the minimum changeover time, the fastest possible output, or just-in-time delivery, this tool proves highly versatile and adaptable.
For a comprehensive exploration of our cloud manufacturing tools, and OEE Tracker specifically book a demo with us today!
Appendix
To assess the business value of an OEE increase from 37% to 60%, we input the following parameters into our ROI Calculator:
- ROI Strategy: We selected intervals ranging from a 30% increase in production value to a 100% increase in production value to offer readers a comprehensive range for possible throughput and revenue enhancements.
- Production Days/ Year: Selected as 250.
- Production Hours/ Day: Selected as 16.
- Production Lines: Selected as 50.
- Average Operators/ Line: Selected as 5.
- Hourly Labor Cost: Selected as $25.
- Annual Revenue: Selected as $50M
- Current OEE: 37%
- Target OEE: 60%
- Gross Margin: 40%
For further information regarding our analysis or guidance regarding how we can improve your OEE, please contact us.
Get Your Free "OEE in Pharma Handbook"
Fill out the form to request your free download.