A histogram can be an effective statistical tool for analyzing lean manufacturing initiatives by visualizing the distribution of product counts per minute or environmental factors like heat and humidity. This allows manufacturers to quickly identify bottlenecks and develop data-driven solutions to improve standardization and efficiency.
With this business benefit in mind, SCW.AI designed the Histogram Analysis, which provides real-time, granular reports for analyzing shop floor activities. In this article, we will first introduce the Histogram Analysis, then highlight five main use cases for manufacturers, demonstrating how line leaders and executives can derive insights in minutes using this user-friendly report.
An Introduction to Histogram Analysis
Histogram Analysis is a manufacturing analytics tool that displays real-time factory data in an automated histogram chart, tailored to the selected line or product, with customizable bin size and data range to illustrate data distribution. Users can choose to view good counts for specific runtime periods to check the production speed of certain lines. Additionally, the tool allows users to analyze the distribution of humidity or heat over any time period, which can be crucial for industries that need to ensure production quality and compliance. In this way, Histogram Analysis provides insights into anomaly detection, master data optimization, and performance losses.
Histogram Analysis is an additional report within the OEE Tracker, which includes various dashboards from OEE Waterfall and Changeover Analysis to Daily Production Performance and Station View, among others. It easily integrates with SCW.AI’s other cloud manufacturing solutions and together ensures end-to-end digital transformation for producers.
Histogram Analysis utilizes automatically collected data from shop floors, such as IoT devices, OPC connections, or Modbus PLCs, eliminating the need for manual effort in generating analysis. Therefore, as we will further illustrate in the use cases section, it can also be used as a tool for double-checking the accuracy of sensor data which is the backbone of all automated factories.
Why Manufacturers Should Utilize Histogram Analysis
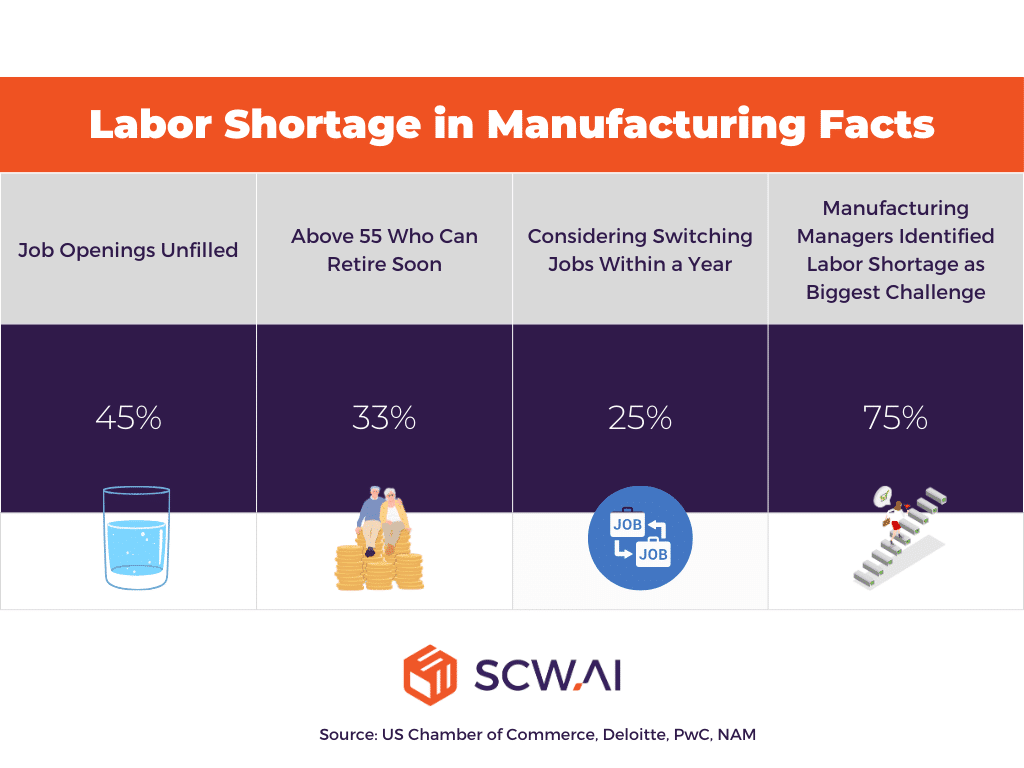
As the image below illustrates, the manufacturing industry is facing a severe labor shortage, which means workers don’t have time for non-value-added tasks such as data collection and interpretation. Histogram Analysis addresses this business need with its real-time data capture and interpretation capabilities.
Additionally, histogram charts are part of the high school curriculum and require only basic data analysis skills. This means that with a quick glance at the Histogram Analysis, users can easily detect important bottlenecks. This is a crucial feature for agile manufacturing, as it allows users to immediately leverage the tool for business outcomes without wasting time trying to understand the digital interface and overcomplicated reports.
Top 5 Use Cases of Histogram Analysis
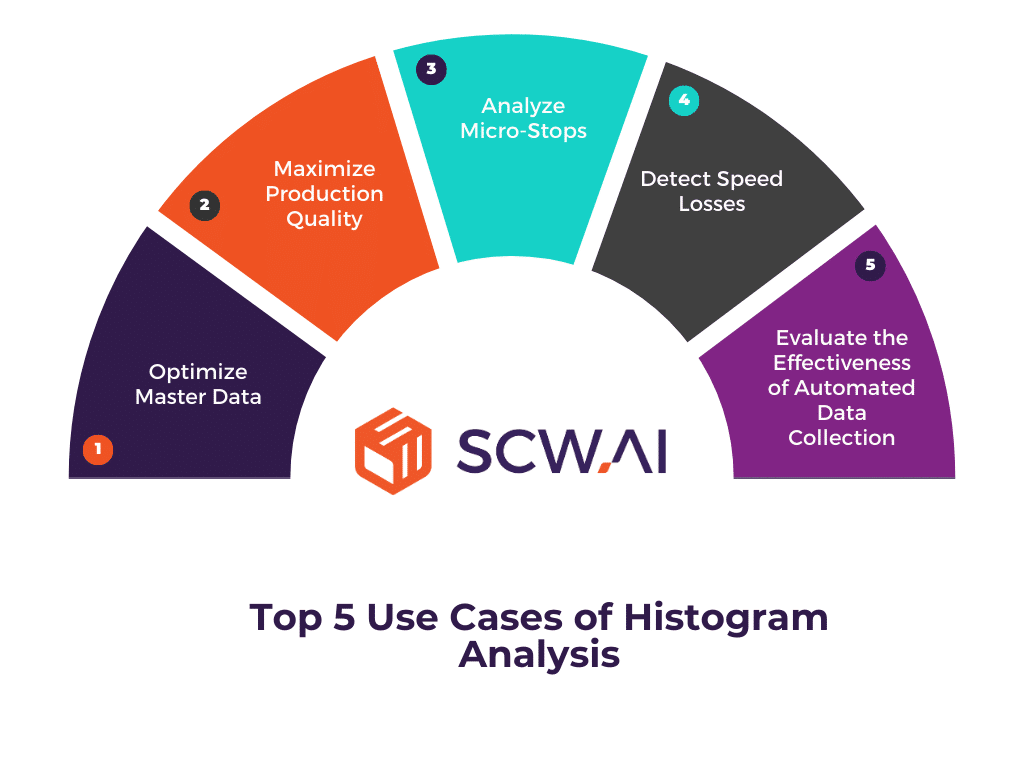
1. Optimize Master Data
Master data should closely reflect reality for specific lines and product types, as planning staff rely on it for accurate job shop scheduling and realistic capacity determination. Inaccurate master data related deviations between planned and actual run times can lead to missed business opportunities and underutilization of resources.
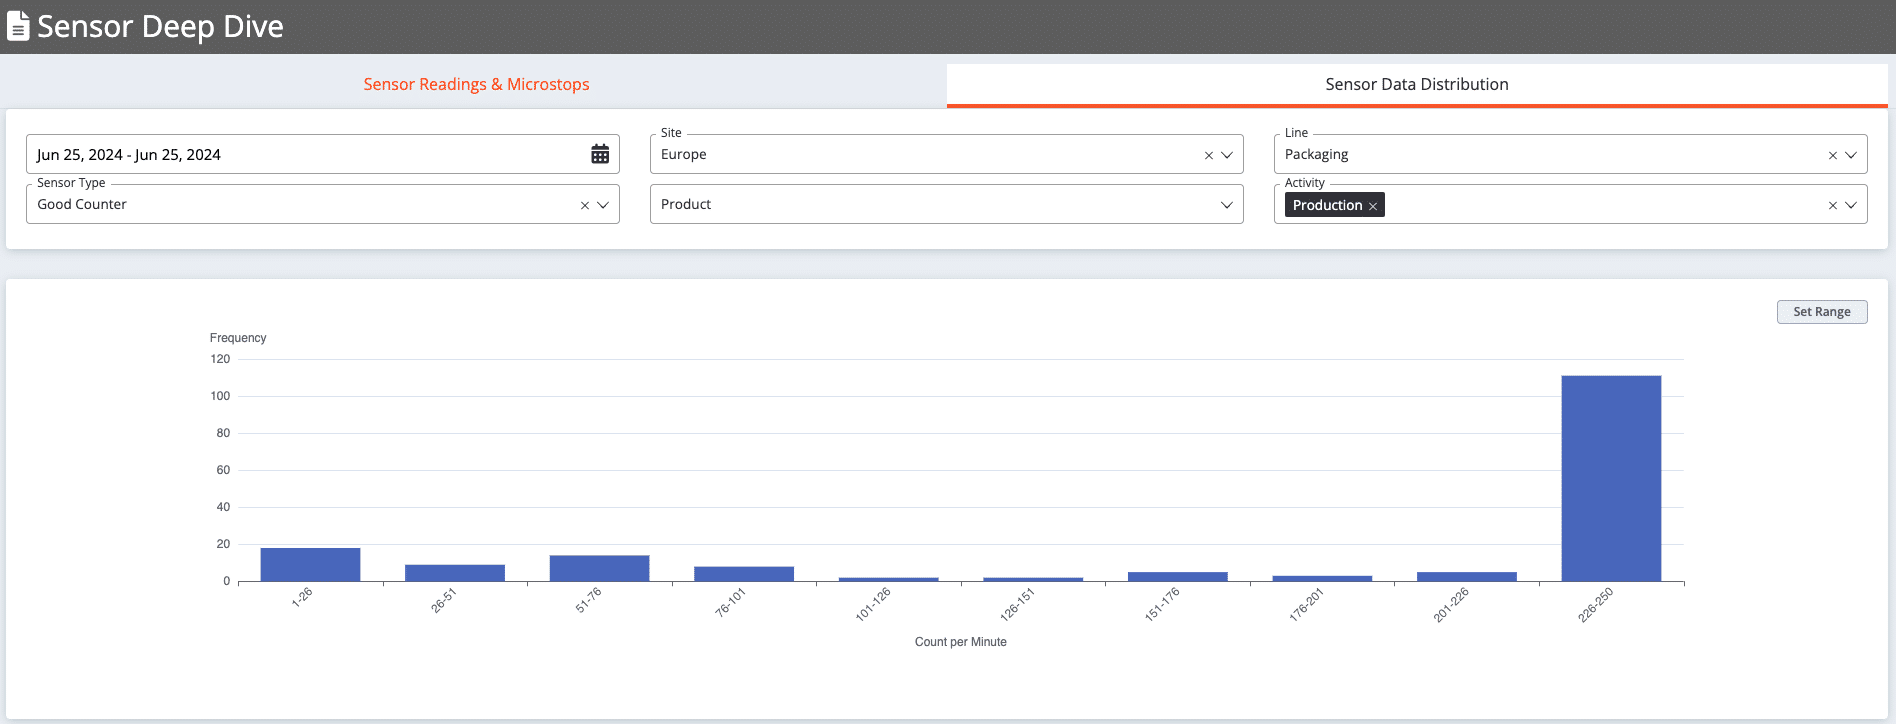
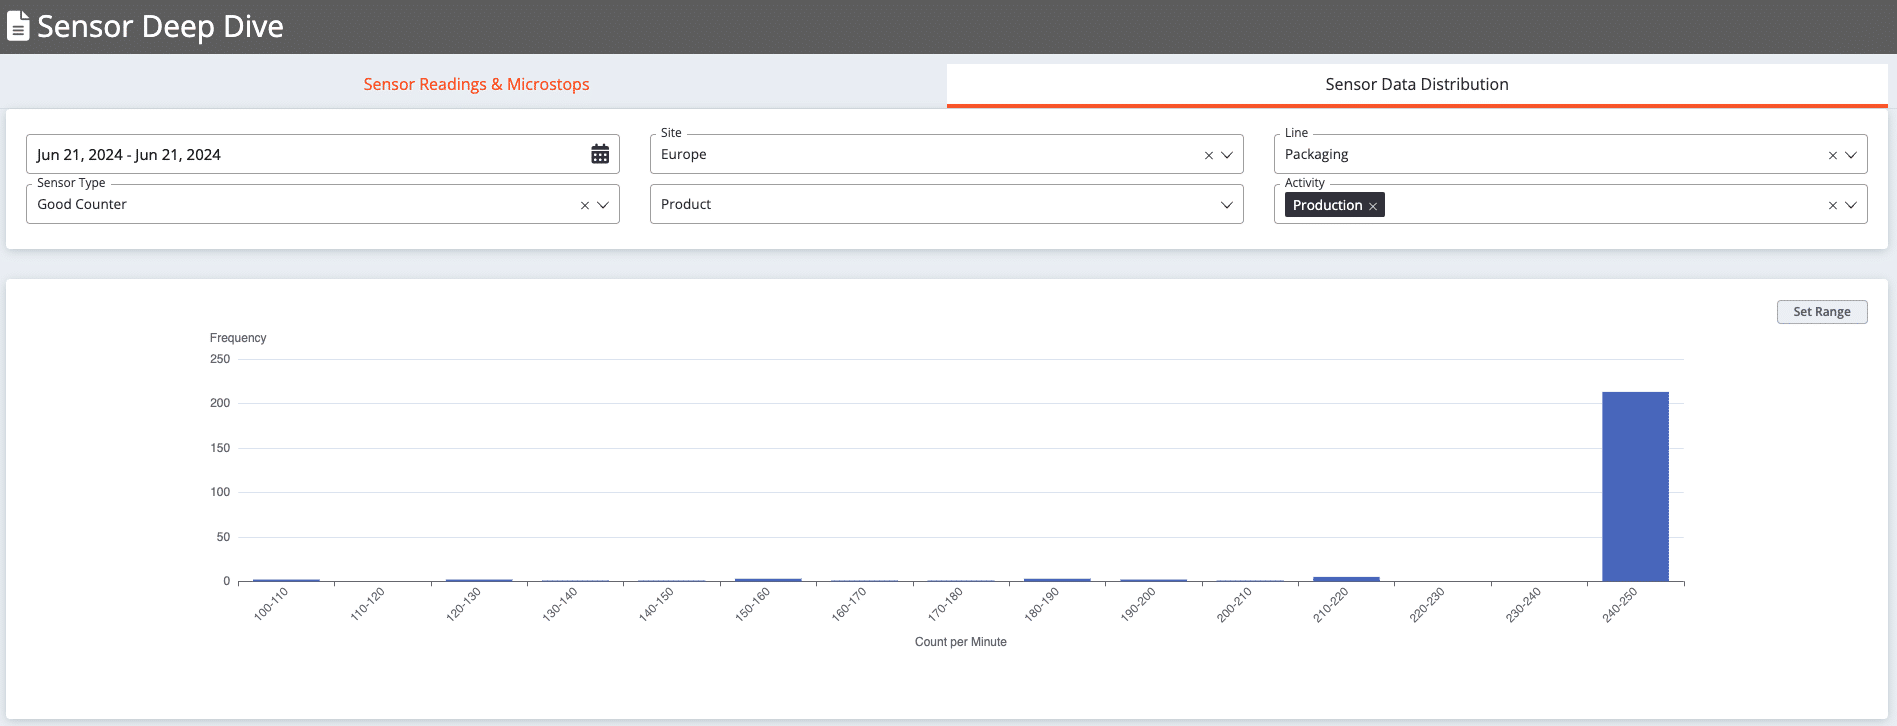
Histogram Analysis helps make master data more realistic. For example, the image below shows a case where the planned production speed for a certain product on a specific line is estimated at 170 pieces per minute. However, the data accumulates in the bin between 240-250 pieces per minute, indicating that the master data underestimates the production speed. After finding such a mistake manufacturers can easily adjust master data which is 240 for this specific example.
2. Maximize Production Quality
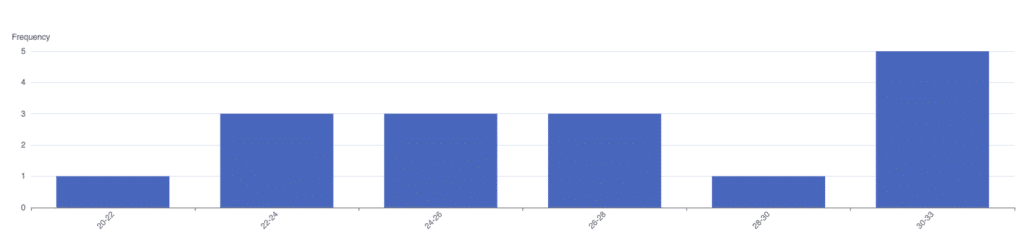
For certain products, yield quality heavily depends on external factors. For example, during the cleaning phase, humidity or temperature must remain within specific ranges or throughout the runtime. The image below illustrates such a case. Suppose the line temperature during the cleaning phase should not drop below 32 degrees Celsius to prevent certain microbes from contaminating the production line. However, Histogram Analysis shows that the temperature during the changeover period frequently falls under 32 degrees, indicating a failure to adhere to production standards or possibly regulations.
In such a case, the manufacturer should correct any quality issues or potentially reproduce the batch to avoid compliance penalties and damage to customer relationships. Histogram Analysis can demonstrate such cases before it is too late.

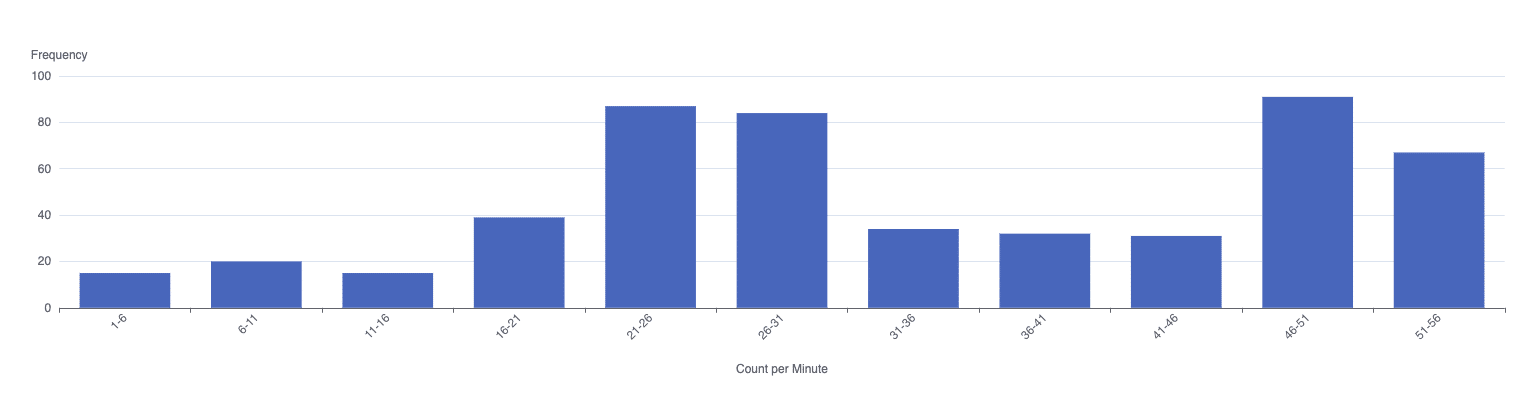
3. Analyze Micro-Stops
During runtime, the product count per minute should be around the target level or slightly slower if the assembly line experiences some speed losses. However, it should never drop to zero unless there are micro stops that temporarily prevent the line from functioning properly.
In such cases, data in the Histogram Analysis will accumulate in bins close to the target ratio and in the bin representing zero. This allows executives to identify lines with chronic micro stop issues and take corrective actions, such as scheduling maintenance or providing additional training for operators responsible for keeping these lines running smoothly.
4. Detect Speed Losses
Histogram Analysis also helps manufacturers detect other components of performance losses in OEE. If production per minute data accumulates in the setup-level bin and other bins below that value but above zero, it indicates a speed loss.
In such a case, the data suggests that the machine’s performance is deteriorating from its full potential. To address this issue, the machine may need lubrication. If this action does not resolve the speed loss, a more detailed maintenance session may need to be scheduled.
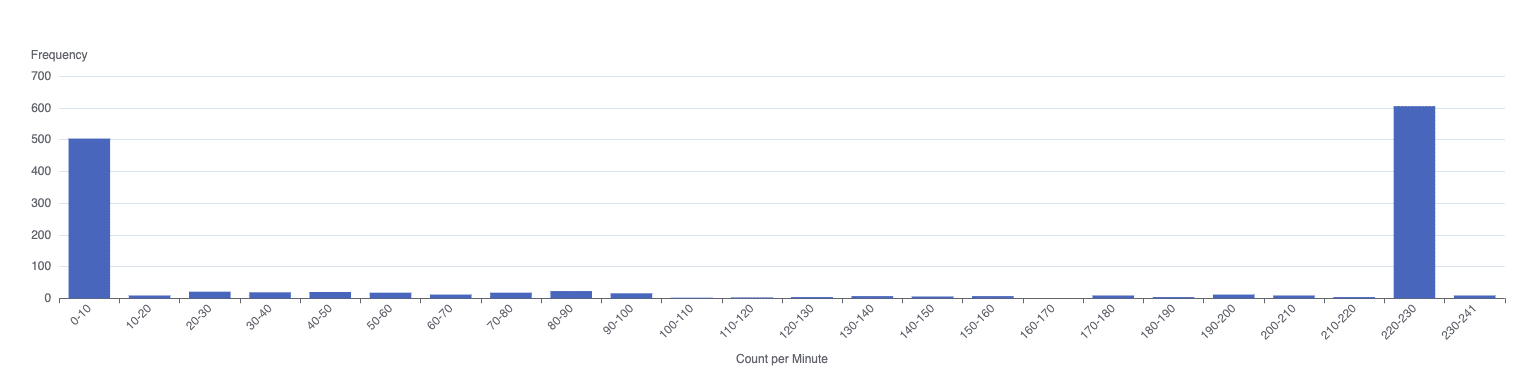
5.Evaluate the Effectiveness of Automated Data Collection
Without accurate automated data, neither automated dashboards nor manufacturing AI models can be trusted for decision-making. Histogram Analysis offers an easy way to verify the health of data flow from sensors to APIs and digital solutions. For example, during changeover, the production count per minute should be zero. However, if the histogram shows data accumulating in other bins, it may suggest that a sensor is misaligned and incorrectly counting operator movements as products.
Transform Your Factory with SCW.AI
SCW.AI’s Digital Factory Platform is a comprehensive solution for monitoring, execution, planning, and compliance challenges faced by manufacturers, featuring modules like:
These modules include automated dashboards such as Histogram Analysis, along with AI capabilities like automated anomaly detection, job shop scheduling, and action assignment, all powered by AI HUB.
To learn more about Histogram Analysis and OEE Tracker, feel free to contact us.
Experience the full capabilities of the Digital Factory Platform by booking a demo today.
