According to a McKinsey study, most manufacturers have not yet utilized their most important asset: their own data. Insights derived from this data could lead to an increase of around 10% in EBITDA. Fortunately, today it is possible for manufacturers to leverage their data in less than 100 days using IoT tools and cloud-based manufacturing analytics. This makes hidden shop floors visible around the clock and automates many repetitive and administrative tasks.
In this article, we explain everything manufacturing executives need to know about manufacturing analytics. We start by defining manufacturing analytics and then introduce a roadmap for adopting this transformative technology. Next, we delve into the benefits and present 10 real-life use cases of manufacturing analytics that enhance line productivity, planning and scheduling, and labor productivity. Finally, we provide tips for selecting the right vendor for manufacturing analytics solutions.
What is Manufacturing Analytics
Manufacturing analytics are digital solutions specifically designed for industrial organizations to automatically collect, display, and interpret shop floor data. These solutions offer flexibility for operators, line leaders, and executives by displaying data according to their needs on various devices, from screens on shop floor walls to iPads and mobile devices.
The main purpose of manufacturing analytics solutions is to improve the visibility and productivity of factories through 24/7 monitoring of production lines and machines (See video below). This continuous monitoring allows executives to easily identify bottlenecks and take action to minimize them, thereby enhancing production quality, reducing machine downtime, optimizing takt time, and more.
With advancements in artificial intelligence (AI) and machine learning (ML), manufacturers can now intelligently automate decision-making tasks. For instance, predictive analytics can proactively schedule maintenance before machine failures occur, and AI schedulers can automate job shop scheduling for various objectives, such as:

Manufacturing Analytics Road Map : 3D Principle
The 3D Principle in manufacturing analytics stands for Data, Dashboard, and Decisions. This framework helps manufacturers maximize the return on investment (ROI) from their analytics solutions.
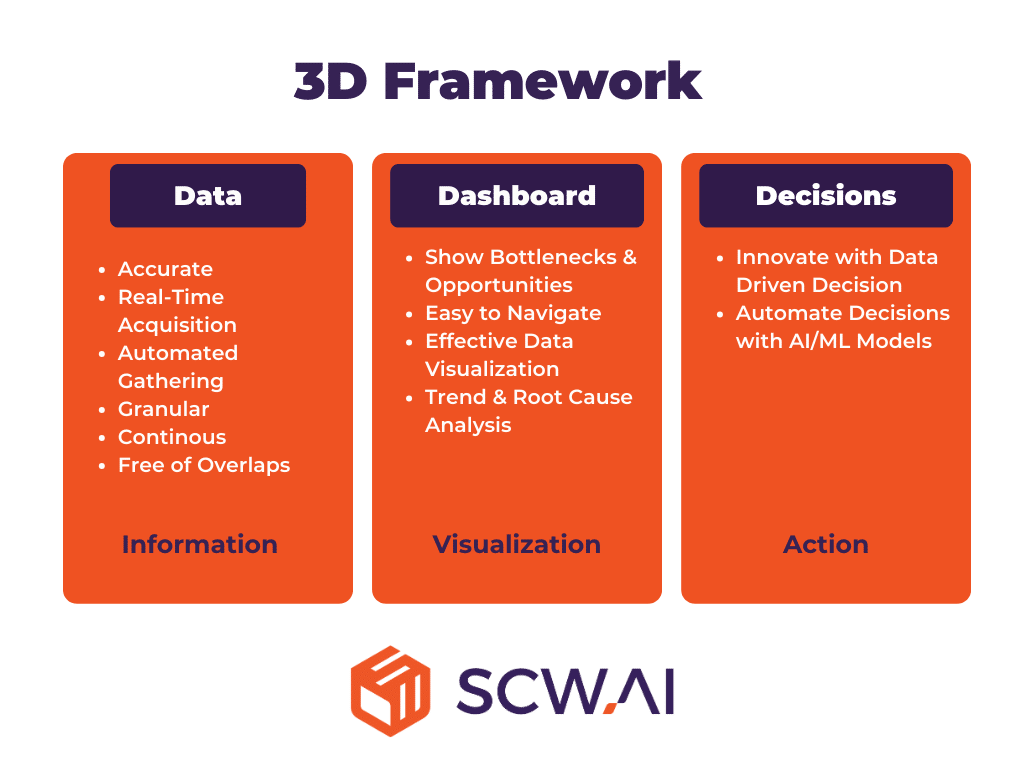
Data
The first step involves collecting real-time shop floor data that is granular, precise, and free of overlaps. This data serves as the backbone for both dashboards and AI tools used in decision-making. High-quality data ensures that the insights derived are accurate and actionable.
Manufacturers have various tools at their disposal for automated data collection. For instance, machines equipped with OPC connections and Modbus PLCs can transfer data via APIs. However, if your machines lack OPC-PLC tools or you cannot share their data with third parties, IoT automation provides a solution. Additionally, IoT tools can collect real-time labor data through RFID cards.
Dashboard
Once the data is collected, the next step is to create automated reports that provide detailed information, line by line and work order by work order, regarding the manufacturing KPIs that need improvement. These KPIs should be selected before implementing manufacturing analytics. When choosing KPIs, managers should focus on their business goals and target low-hanging fruits initially—areas where enhanced visibility can lead to quick improvements.
As we will further introduce dashboards can provide information regarding:
- Line productivity
- Quality of production
- Scheduling
- Labors
- Carbon emissions and many more.
Decisions
The final step is decision-making. While many high quality decisions can be made manually using the data from dashboards, AI solutions can often make better decisions for various tasks such as:
- Optimize job scheduling.
- Automate maintenance schedules.
- Enhance labor allocation.
- Improve line balancing through digital twins.
The success of AI in manufacturing stems from the vast amounts of historical data available, which can be effectively interpreted using the high computational power of AI models specialized in specific tasks.
By following the 3D Principle, manufacturers can effectively leverage manufacturing analytics to enhance their operations and drive innovation. To see the potential return of your industry 4.0 investments you can use our ROI Calculator.
Top 4 Benefits of Manufacturing Analytics
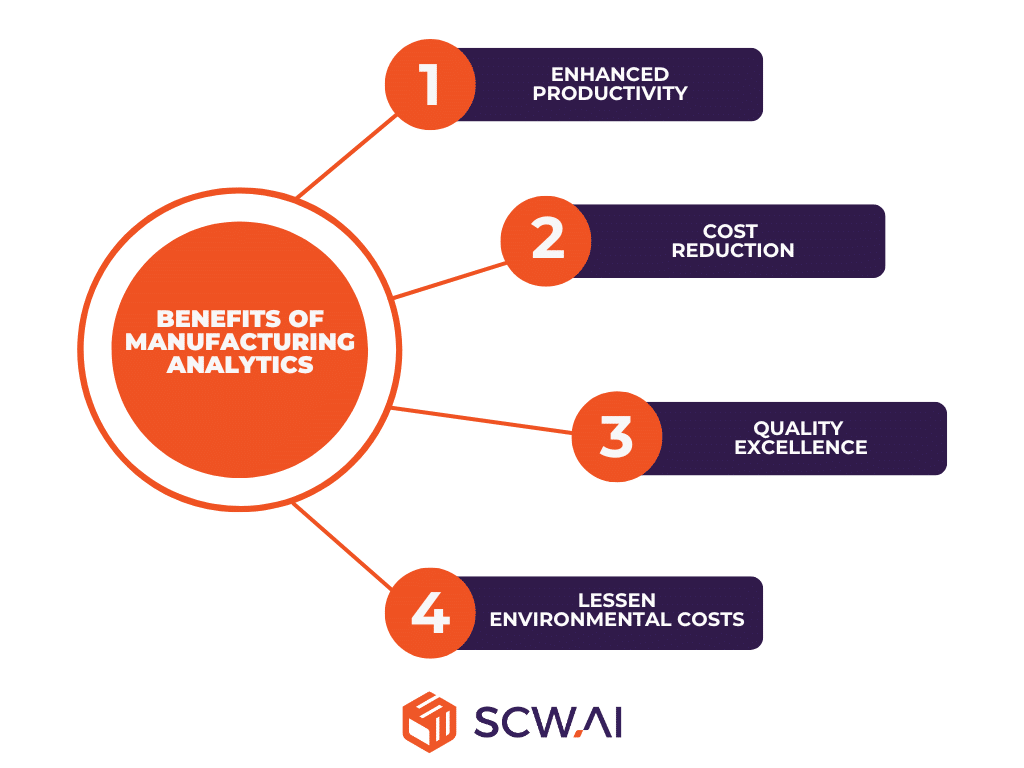
- Enhanced Productivity: Manufacturing analytics enable real-time monitoring and analysis of production processes, leading to increased productivity. By identifying inefficiencies with reports and alerts, manufacturers can optimize their operations, streamline workflows, and maximize output.
- Cost Reduction: By providing detailed insights into resource utilization, manufacturing analytics help in reducing operational costs. This includes minimizing waste and machine downtime, optimizing inventory levels, and improving energy efficiency.
- Quality Excellence: Manufacturing analytics facilitate continuous quality improvement by monitoring metrics like scrap rate and identifying defects early in the production process. This ensures that products meet high standards and reduces the cost of rework. Data analytics also help in maintaining consistency and compliance with industry standards.
- Lessen Environmental Costs: Enhanced visibility into operations allows manufacturers to adopt greener practices and meet regulatory requirements. In addition, higher efficiency reduces environmental cost per product.
Top 10 Use Cases of Manufacturing Analytics
For easy readability, we have divided the use cases into three categories:
- Line Productivity Related Analytics
- Planning and Scheduling Related Analytics
- Labor Productivity Related Analytics
Let us start with line productivity related manufacturing analysis.
Line Productivity Related Manufacturing Analytics
1. OEE Waterfall Analysis
Overall Equipment Effectiveness (OEE) is a commonly used metric for assessing the production efficiency of manufacturers. It is found by multiplying the availability, performance, and quality ratios of production. This composite metric provides rich information about production losses/quality and supports lean practices by highlighting areas for improvement.
As shown in the image below, the OEE Waterfall Analysis provides granular data for each loss category using an intuitive waterfall chart. This visualization allows manufacturers to quickly identify bottlenecks at a glance. For instance, in the line presented, unplanned downtime is not a significant source of losses. On the contrary, the line leader should focus on minimizing the changeover period, particularly the cleaning phase, through effective scheduling and training.

In addition to its visual clarity, OEE Waterfall Analysis enables manufacturers to assess each production line and work order over a preferred time interval. This flexibility allows engineers to track progress towards goals and measure the effectiveness of actions taken to address identified bottlenecks.
Are you operating in the pharmaceutical industry and interested in comparing the OEE between traditional manufacturers and Pharma 4.0 companies? Read our World Class OEE in Pharma: A Benchmarking Analysis article for detailed information.
2. Changeover Analysis
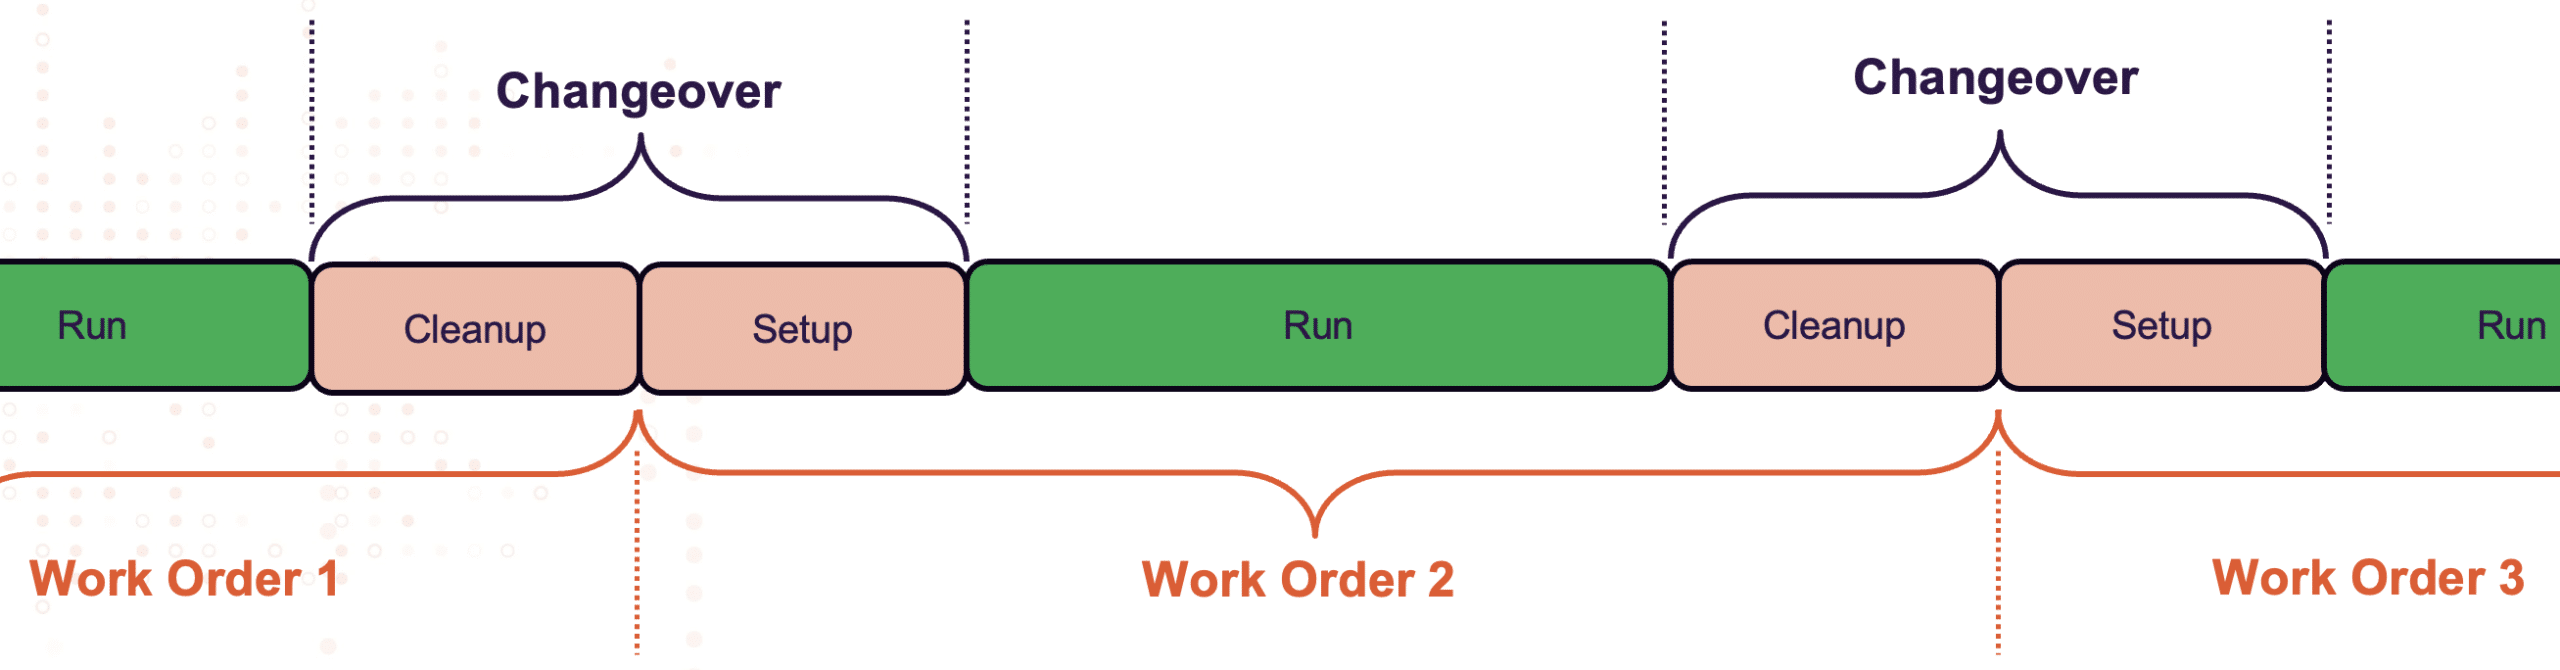
Changeovers, which encompass the sum of clean-up and set-up processes, are particularly time-consuming in regulated industries like pharmaceuticals and food and beverage, where cleaning the line between different product families is crucial to ensure public health. These processes can take up around 30% of staff time in such industries.
Changeover Analysis provides insights for reducing changeover time in two significant ways. Firstly, the analysis allows manufacturers to see the number of major and minor changeovers. An increase in the number of minor changeovers indicates that scheduling has improved, with the same product families being produced consecutively, thereby minimizing the need for major clean-ups.
Secondly, Changeover Analysis highlights the target duration for each changeover activity. This enables manufacturers to identify which labor groups or product families are associated with longer-than-planned changeovers. Once training needs are determined, manufacturers can utilize generative AI technology to provide specific set-up or clean-up instructions through written documents and videos. Furthermore, generative AI can prepare quizzes to assess whether the employees have effectively learned the new procedures.
3. Daily Production Analysis (Augmented Takt Time)
Many manufacturers constantly monitor takt time to ensure line balancing and meet customer demand on time. Our Daily Production Analysis compares target production with actual production and provides production estimates by considering real-time production speed and OEE. This augmented analysis allows line leaders and executives to make data-driven decisions instantly.
For instance, line leaders and executives can:
- Reallocate Labor and Capital: Quickly shift resources to different lines to ensure all daily tasks are completed on time.
- Make Informed Decisions: In the case of short deadlines with potential OTIF penalties, managers can decide on overwork by checking this report only.
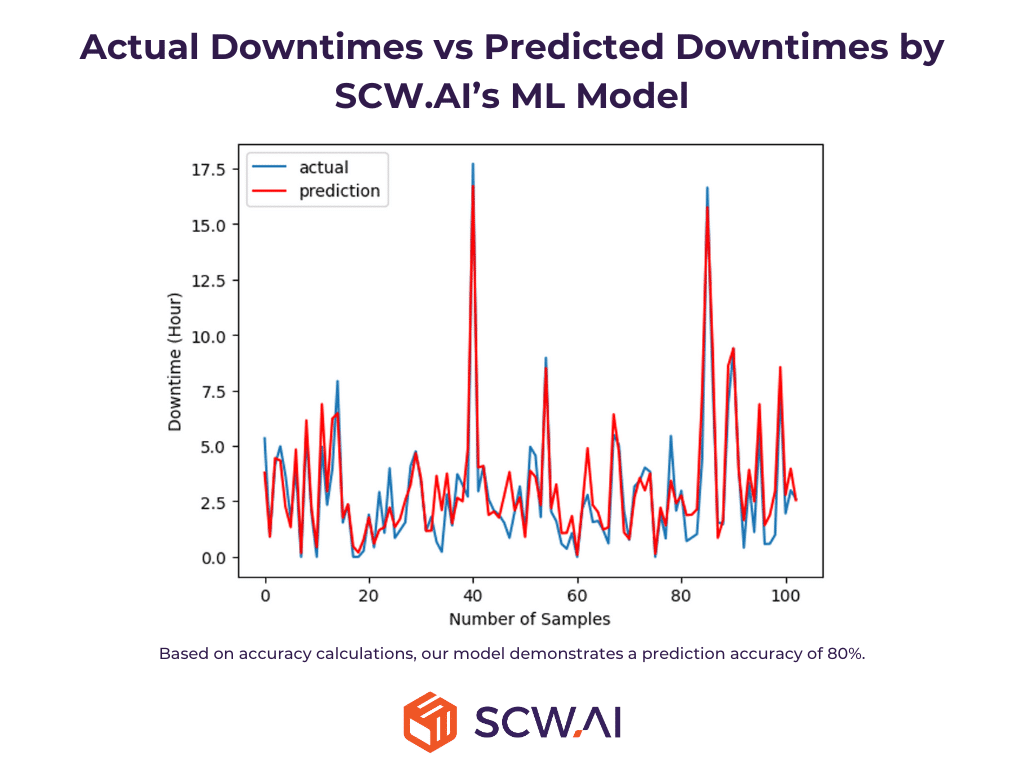
4. Predictive Analytics in Manufacturing
Predictive analytics involve the use of machine learning models to reduce unplanned downtime of equipment without significantly increasing planned maintenance activities. By utilizing historical machine and factory data, predictive analytics can forecast potential equipment failures and schedule maintenance proactively.
According to a study by Deloitte, predictive analytics can increase equipment run time by 10% to 20% while reducing overall maintenance costs.
Moreover, predictive analytics automate maintenance scheduling, reducing the effort required by managers by half. This is particularly beneficial in combating the labor shortage that is currently affecting the manufacturing industry.
Planning and Scheduling Related Manufacturing Analytics
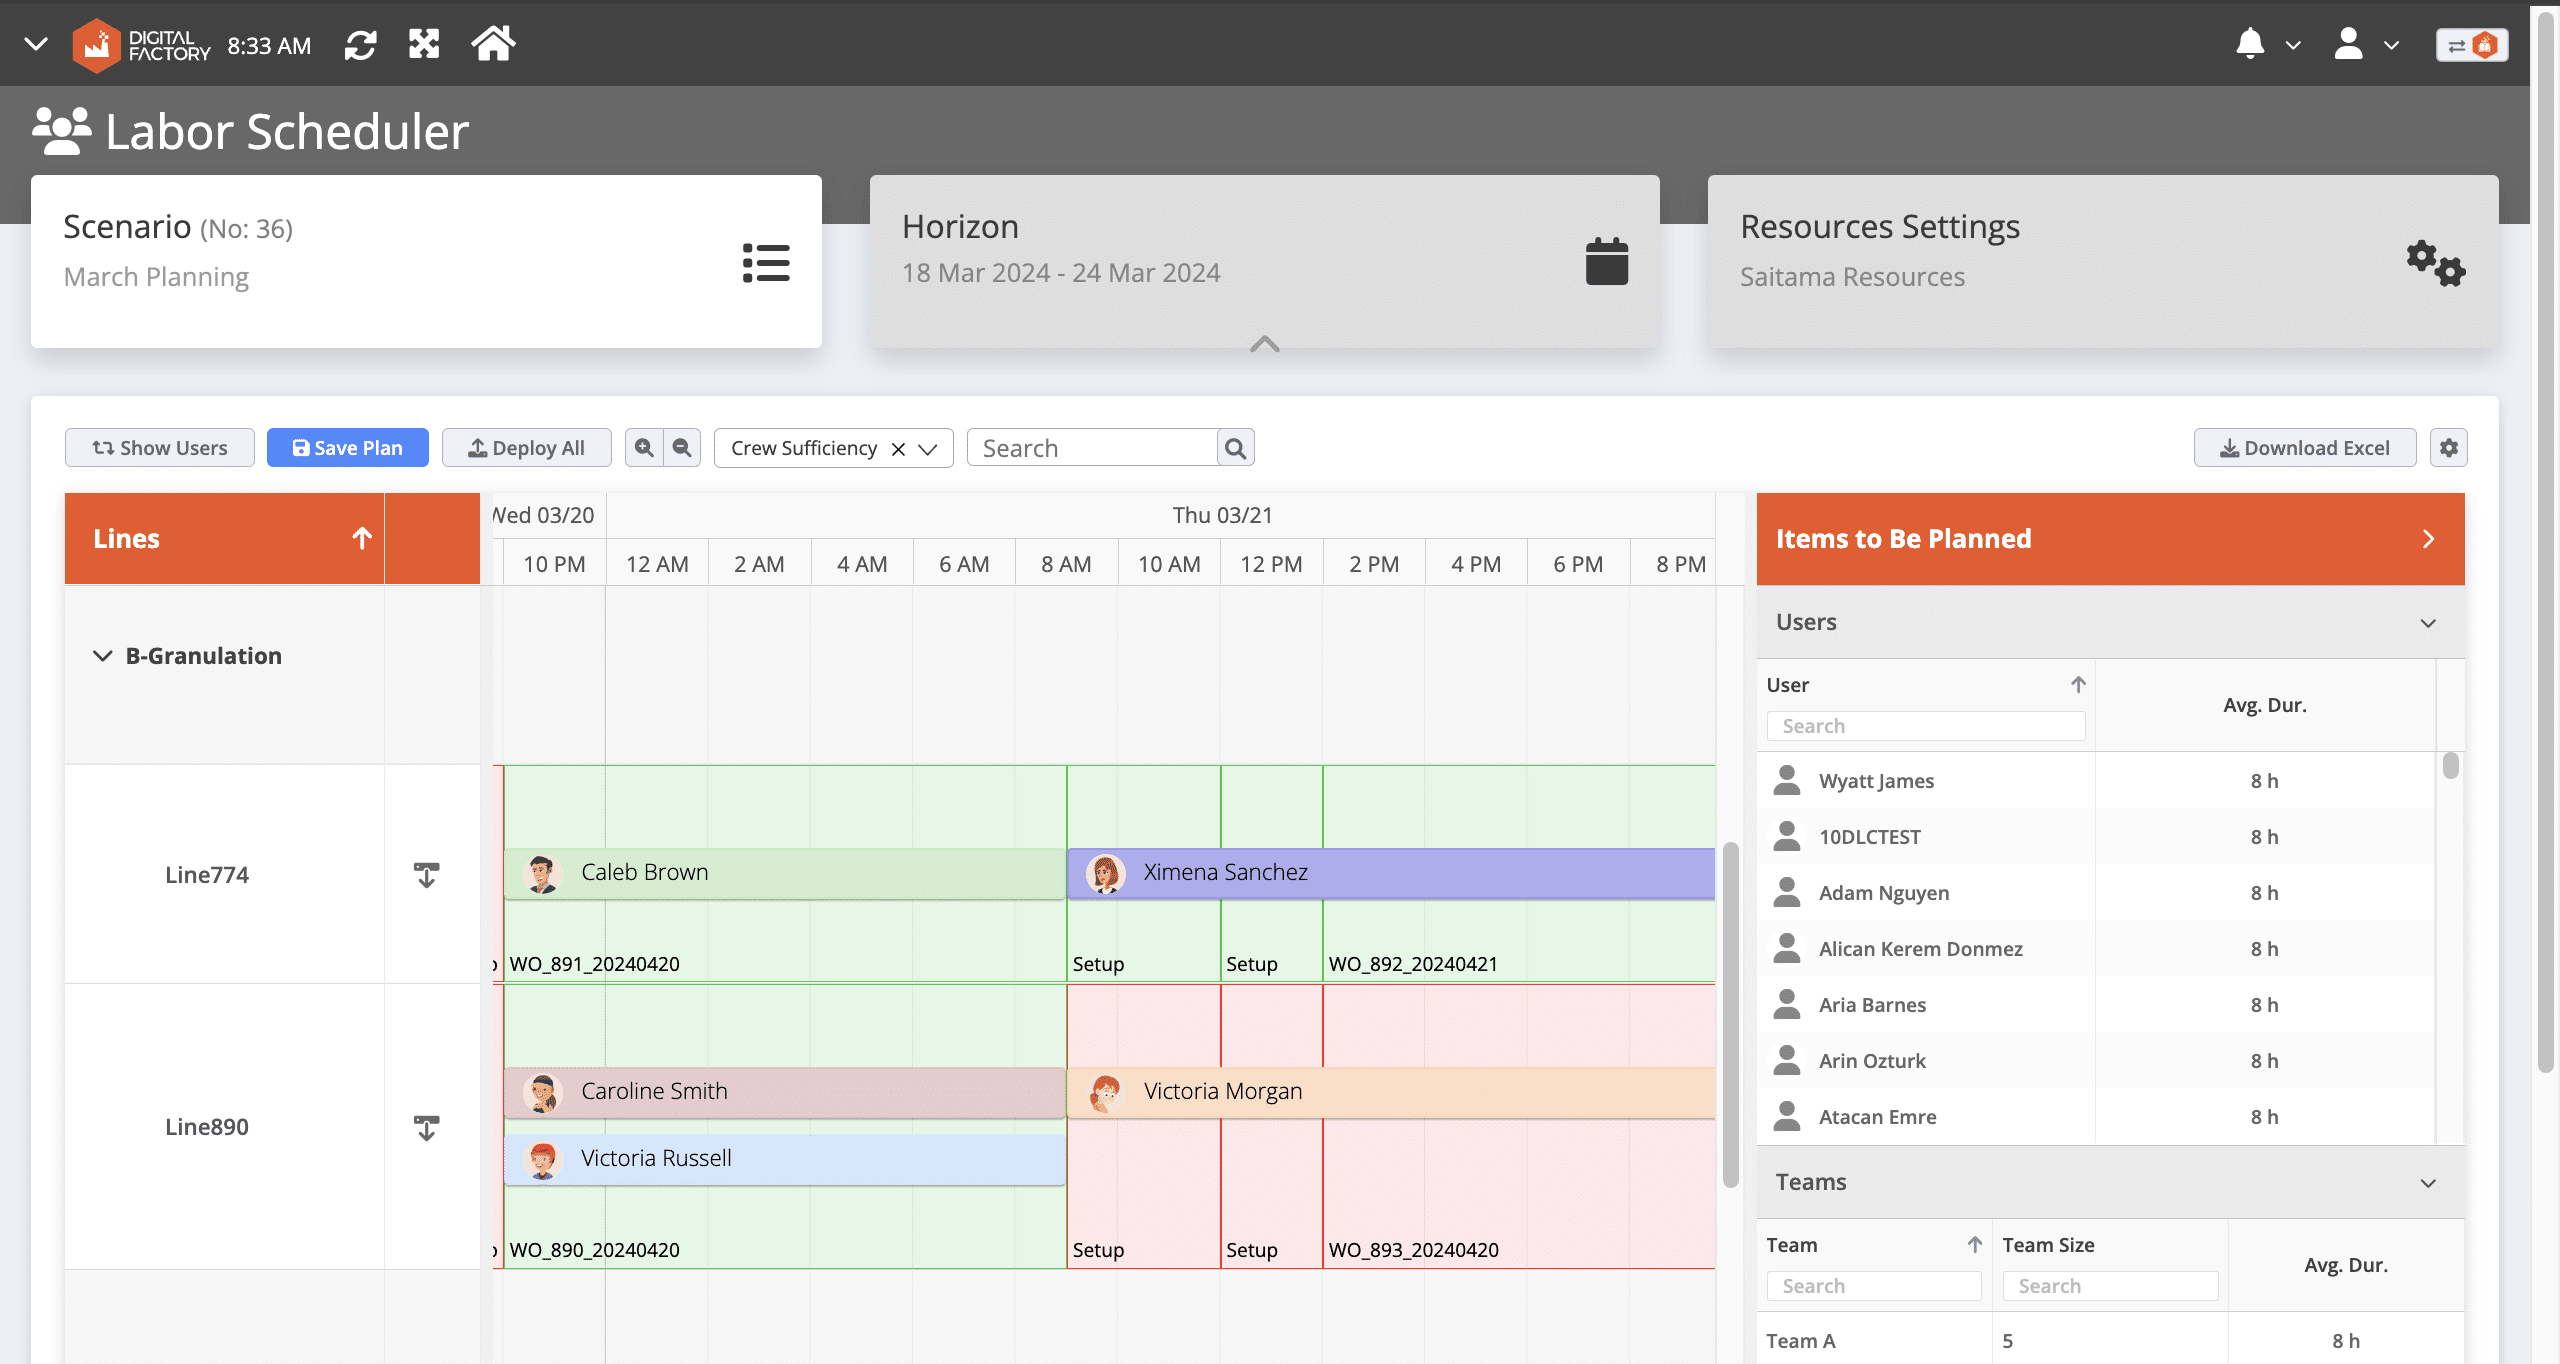
5. AI Scheduling
Due to the vast number of possibilities, finding near-optimal scheduling solutions is a difficult and time-consuming task for humans. A report by Boston Consulting Group shows that by using AI, the time required to prepare schedules can be reduced by half, while factories can generate an extra 30 minutes of productive time on average per day.
As shown in the video below, our advanced planning and scheduling system solves complicated job shop scheduling for different business needs with just one click.
Here is how AI schedulers can be tailored to various industries:
- Food and Beverage Industry: Use just in time algorithms to ensure the freshness of products.
- Pharmaceutical Industry: Utilize changeover minimization algorithms to reduce the time spent on cleaning and setting up between different product families.
- General Manufacturing: Choose OTIF maximization if your clients bind you with On-Time OTIF agreements.
Additionally, our Scheduler provides a digital interface for labor scheduling. Planners can see how many employees should be assigned to each line, ensuring optimal labor force allocation.
6. Schedule Adherence Analysis
Planned and actual production can differ significantly due to production or scheduling inefficiencies. To understand the source of these deviations, manufacturers often check metrics such as schedule adherence, schedule attainment, and schedule compliance.
For instance, if schedule attainment is consistently higher than schedule adherence and schedule compliance is low, it likely indicates that the factory is productive but the scheduling team has difficulties finding optimal work allocation.
Monitoring all these metrics in real-time for hundreds of work orders is a challenging task without a real-time dashboard. Our Schedule Adherence Report shows the mentioned KPIs for the lines you want to check over a specified duration.

Additionally, you can analyze inefficiencies by monitoring data for planned and actual:
- Run Time
- Cleaning Time
- Set-Up Time

By utilizing these insights, manufacturers can successfully execute realistic production schedules and address scheduling inefficiencies effectively.
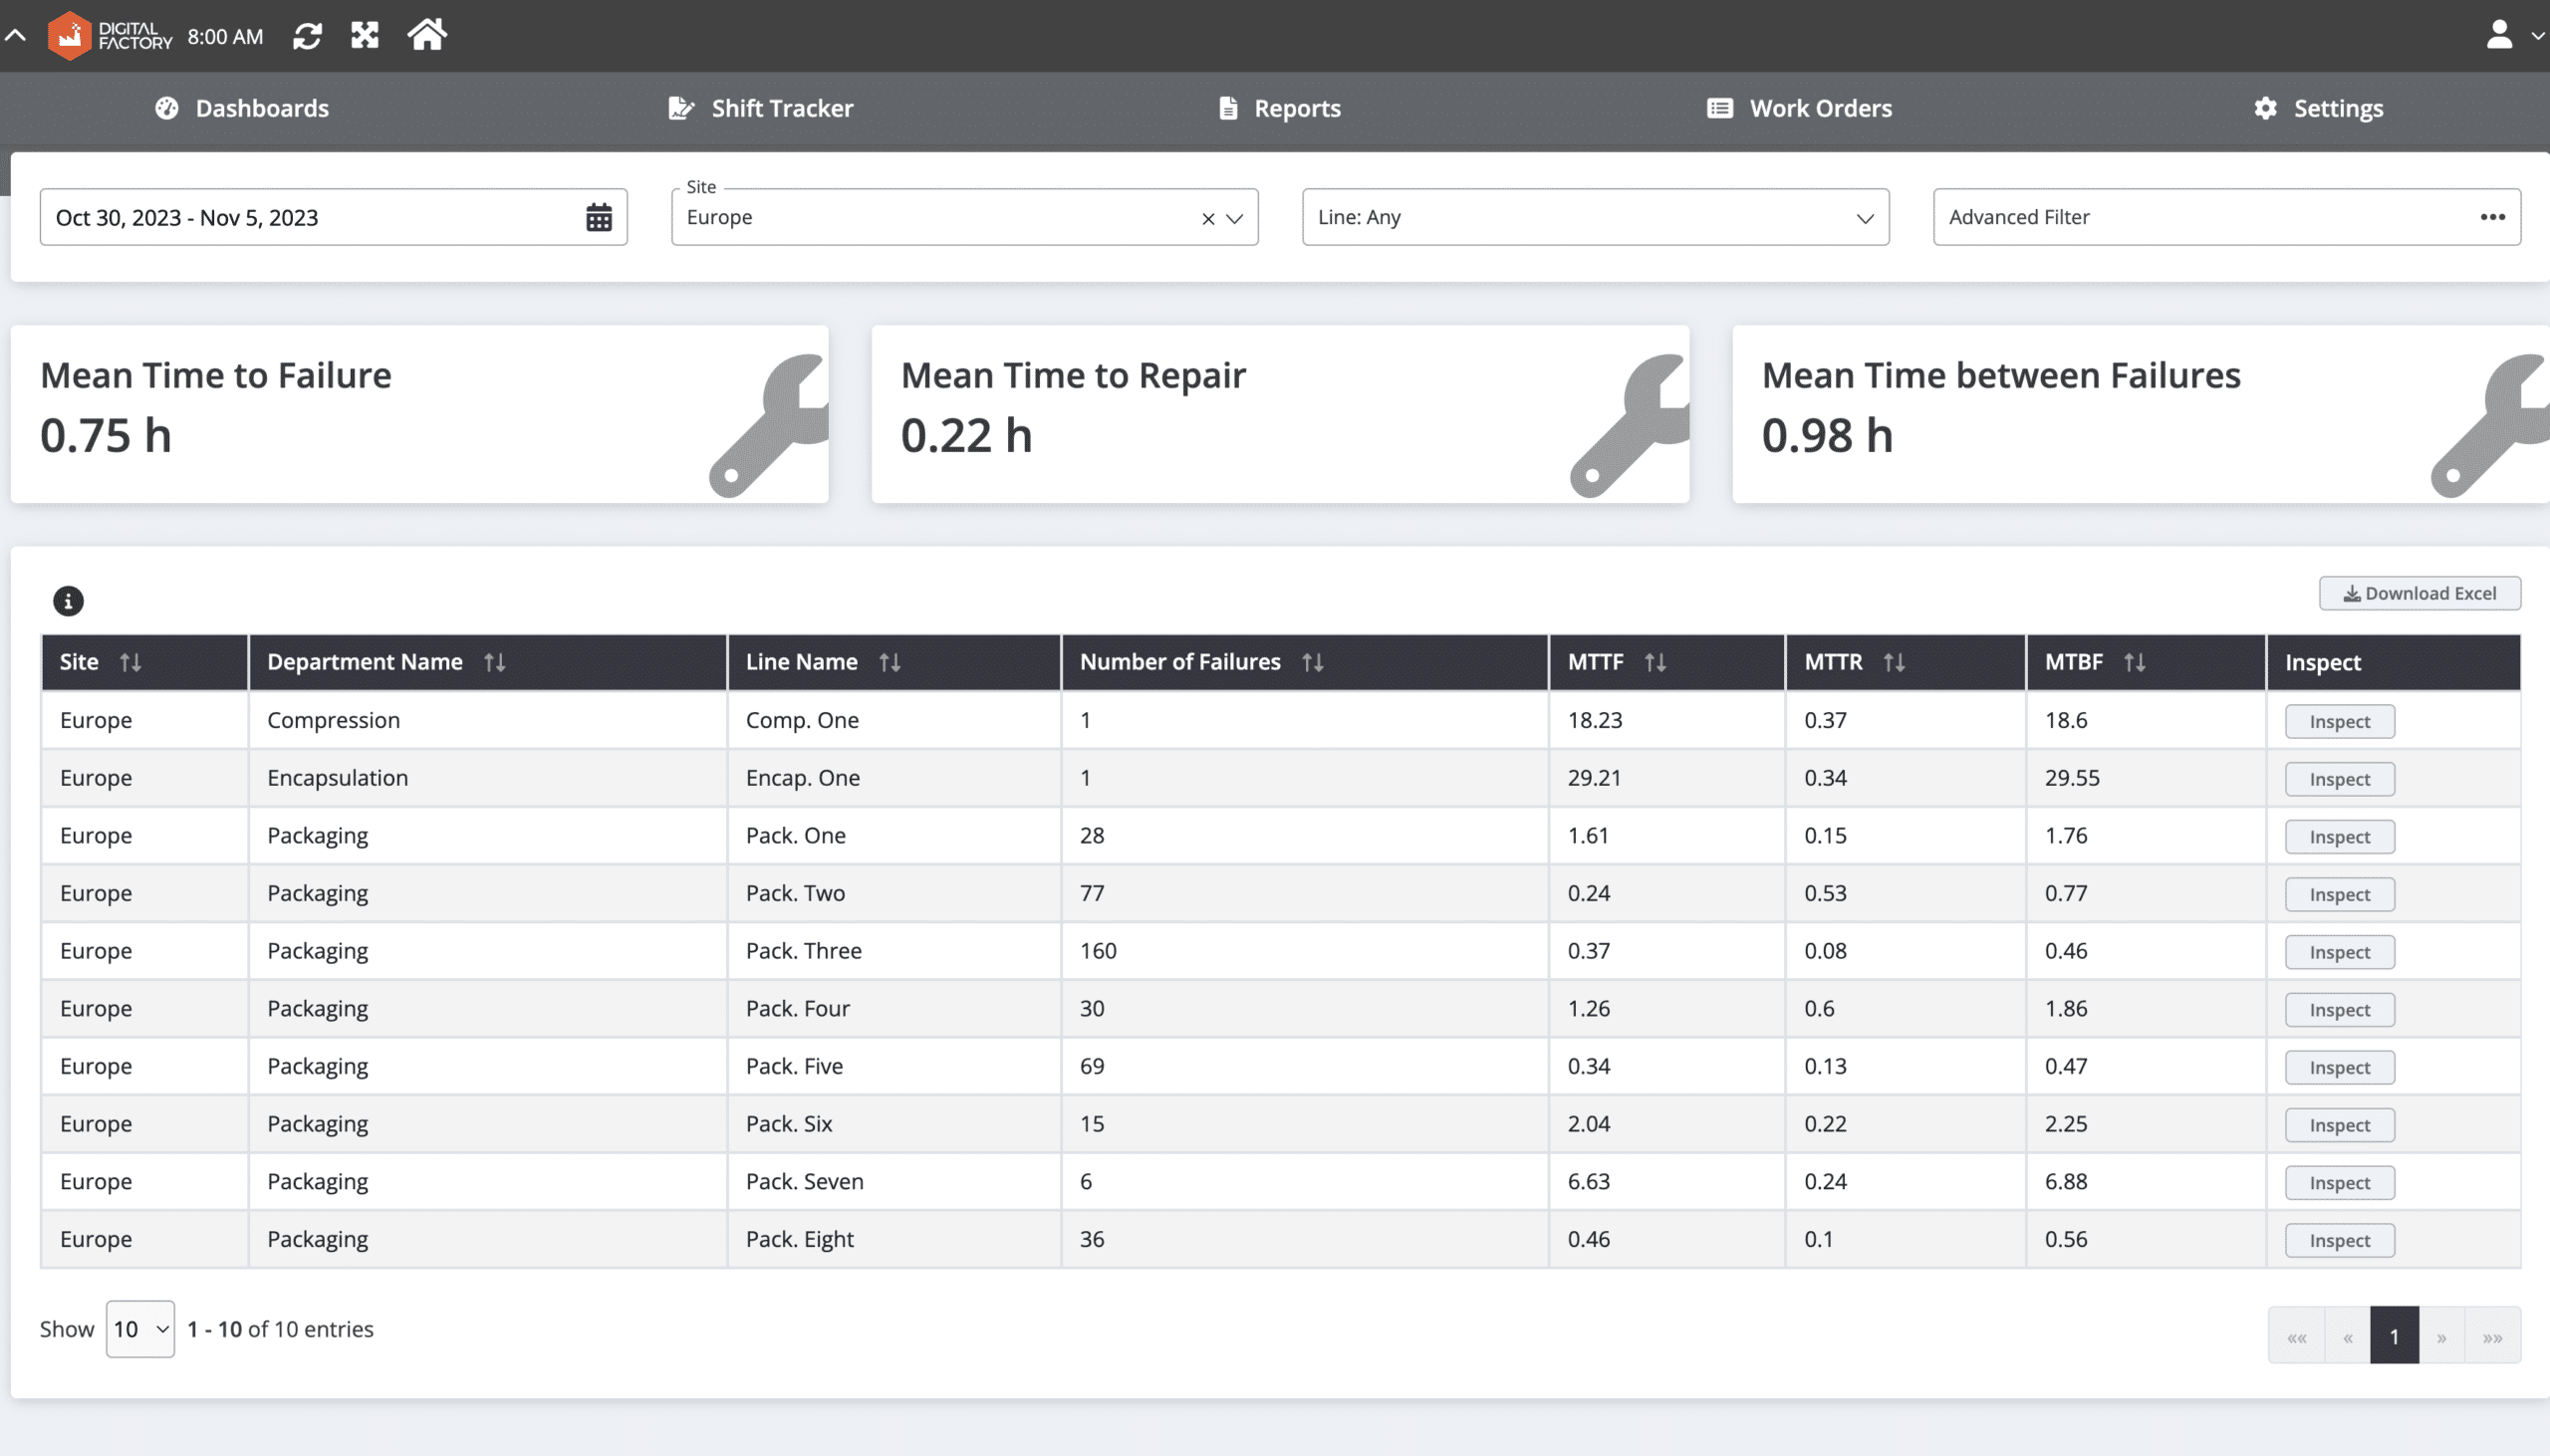
7. Maintenance Performance Analysis
To increase the return on Total Productive Maintenance (TPM) activities, visibility into machine health is crucial. A Maintenance Performance Report provides this visibility by offering real-time information on key metrics such as mean time to failure (MTTF), mean time to repair (MTTR), and mean time between failures (MTBF).
Once manufacturers have this information, they can utilize it to enhance TPM in two main ways:
- Predictive Analytics: Train predictive analytics models using this data to forecast potential machine failures and schedule maintenance proactively.
- Preventive Maintenance: Maintenance teams can use this data to determine optimal preventive maintenance schedules, ensuring that equipment is serviced before issues arise.
Nevertheless, by leveraging Maintenance performance analysis, manufacturers can reduce unplanned downtime and achieve a more predictable shop floor environment.
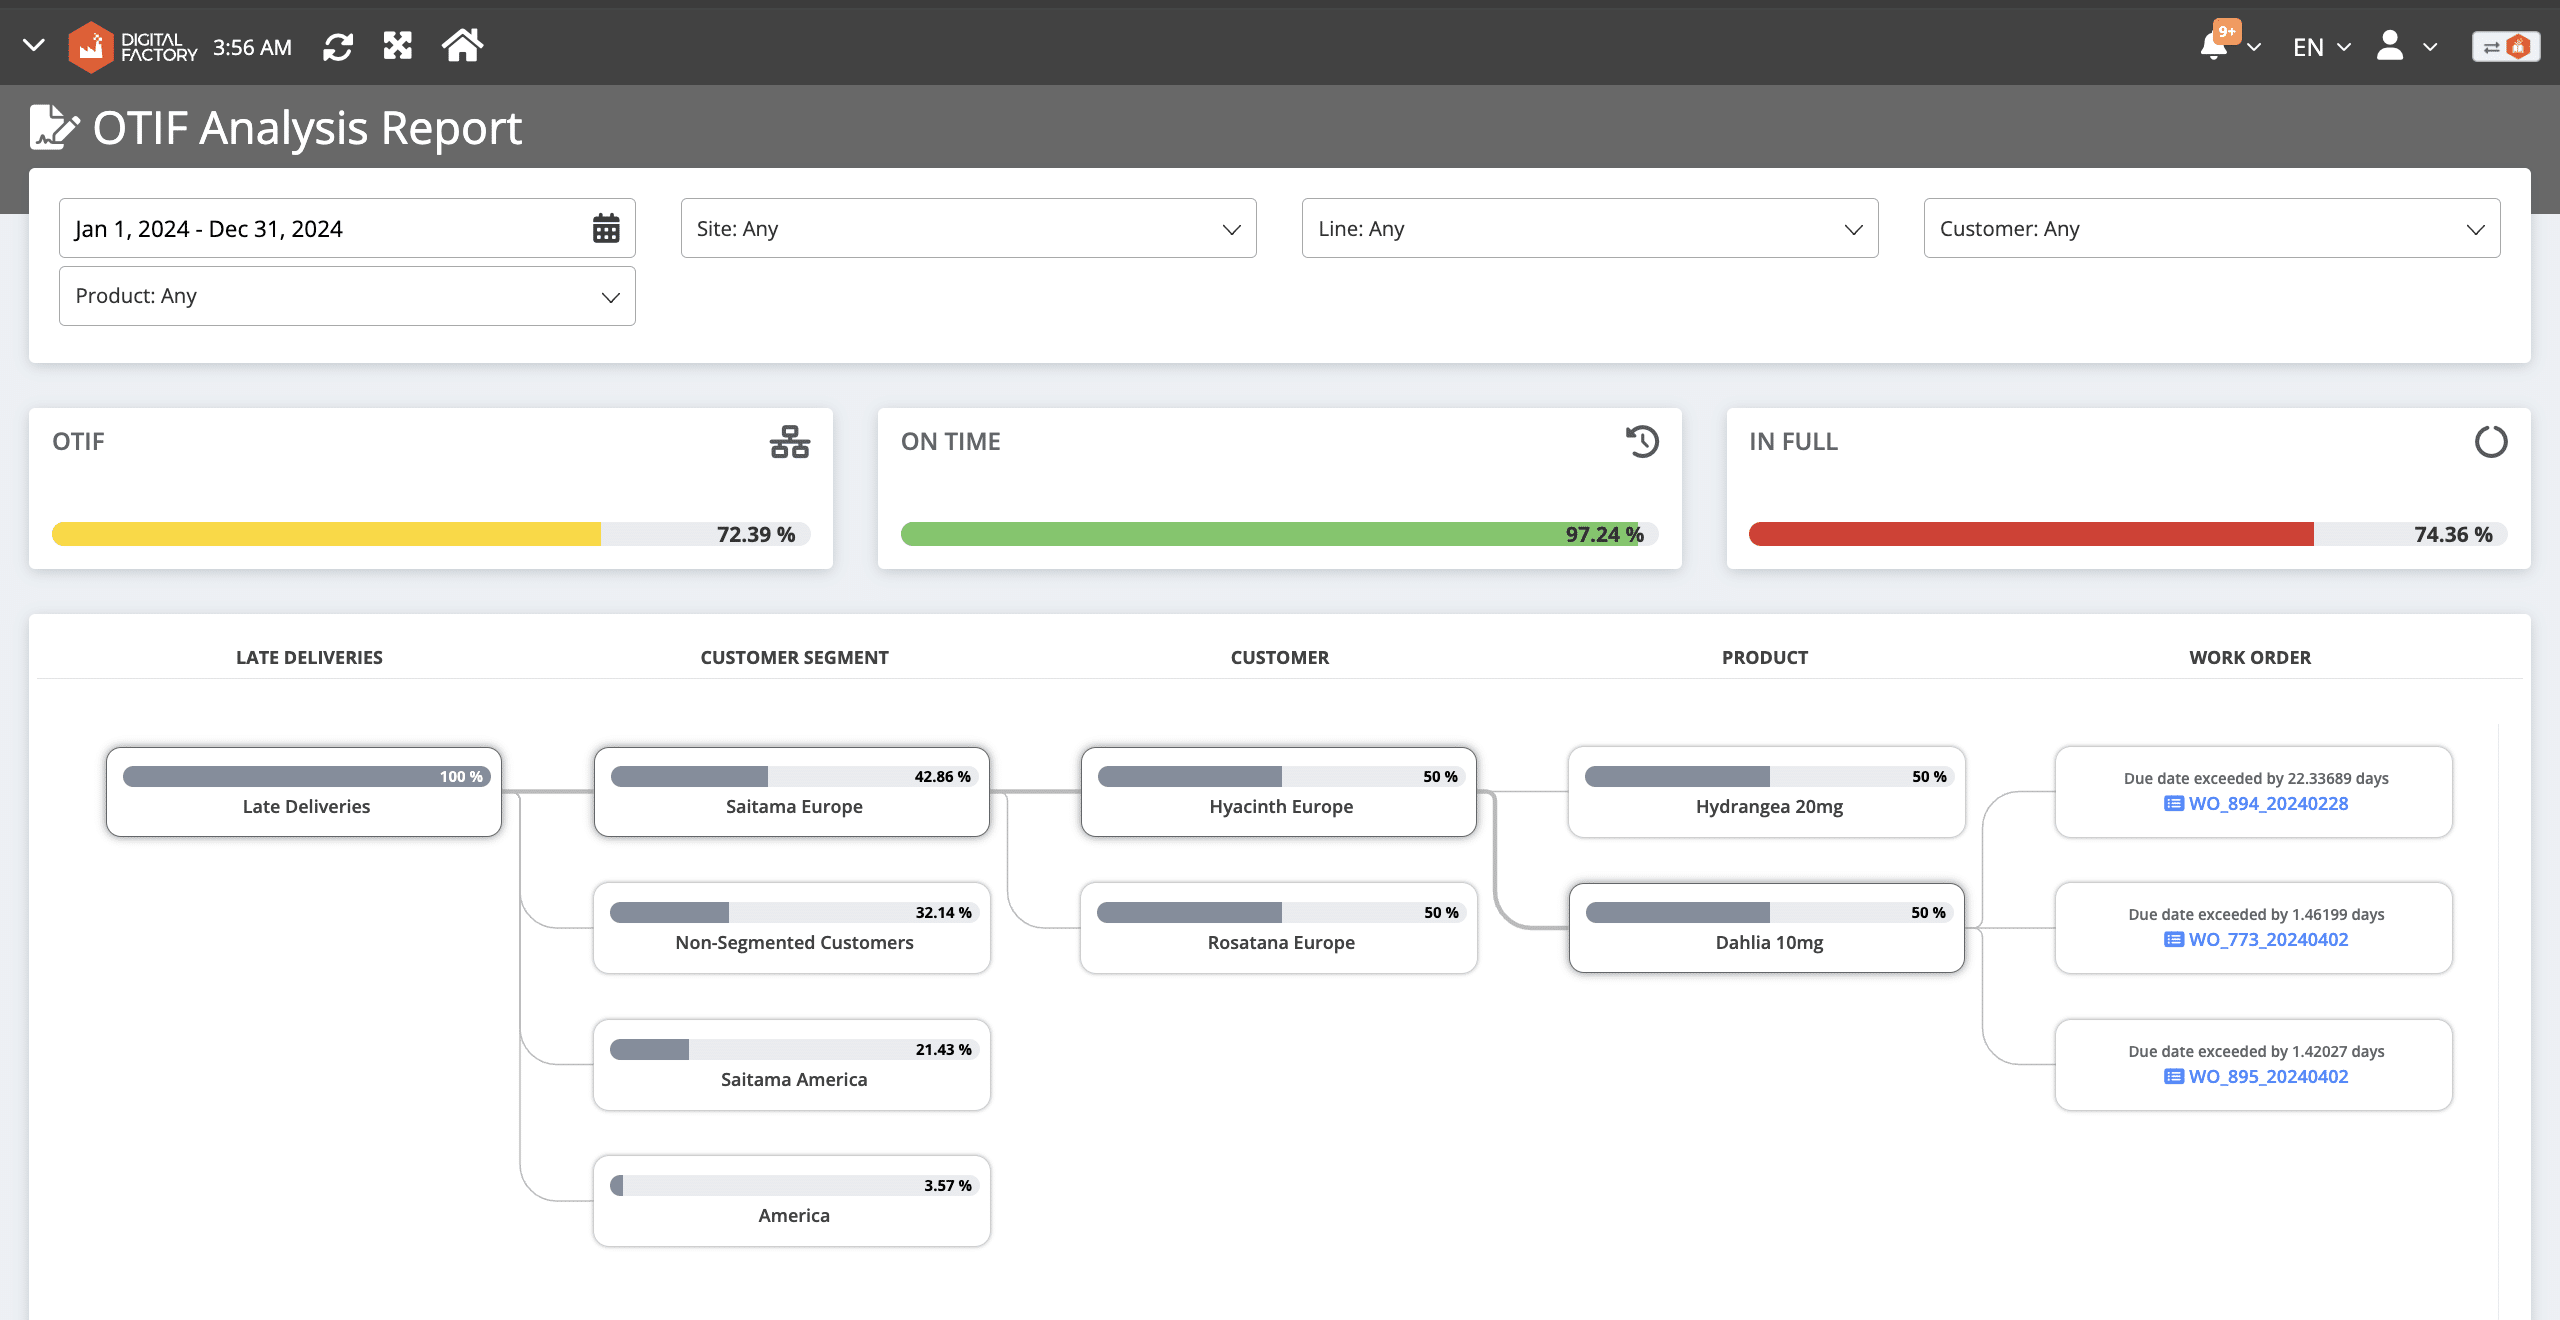
8. OTIF Analysis
OTIF is a critical metric for measuring the performance of manufacturing delivery processes. According to Forbes, OTIF penalties for a medium-sized manufacturer can exceed $300,000. Additionally, low OTIF scores can damage relationships with clients, affecting future business opportunities.
OTIF Analysis provides detailed information about your OTIF performance with different customers. This analysis helps manufacturers identify which customers have good OTIF scores and which need improvement. By creating a prioritization list based on agreements and the importance of customers, manufacturers can manage customer relationships more effectively and avoid fines in case of production bottlenecks.
Labor Productivity Related Manufacturing Analytics
9. Labor Performance Analysis
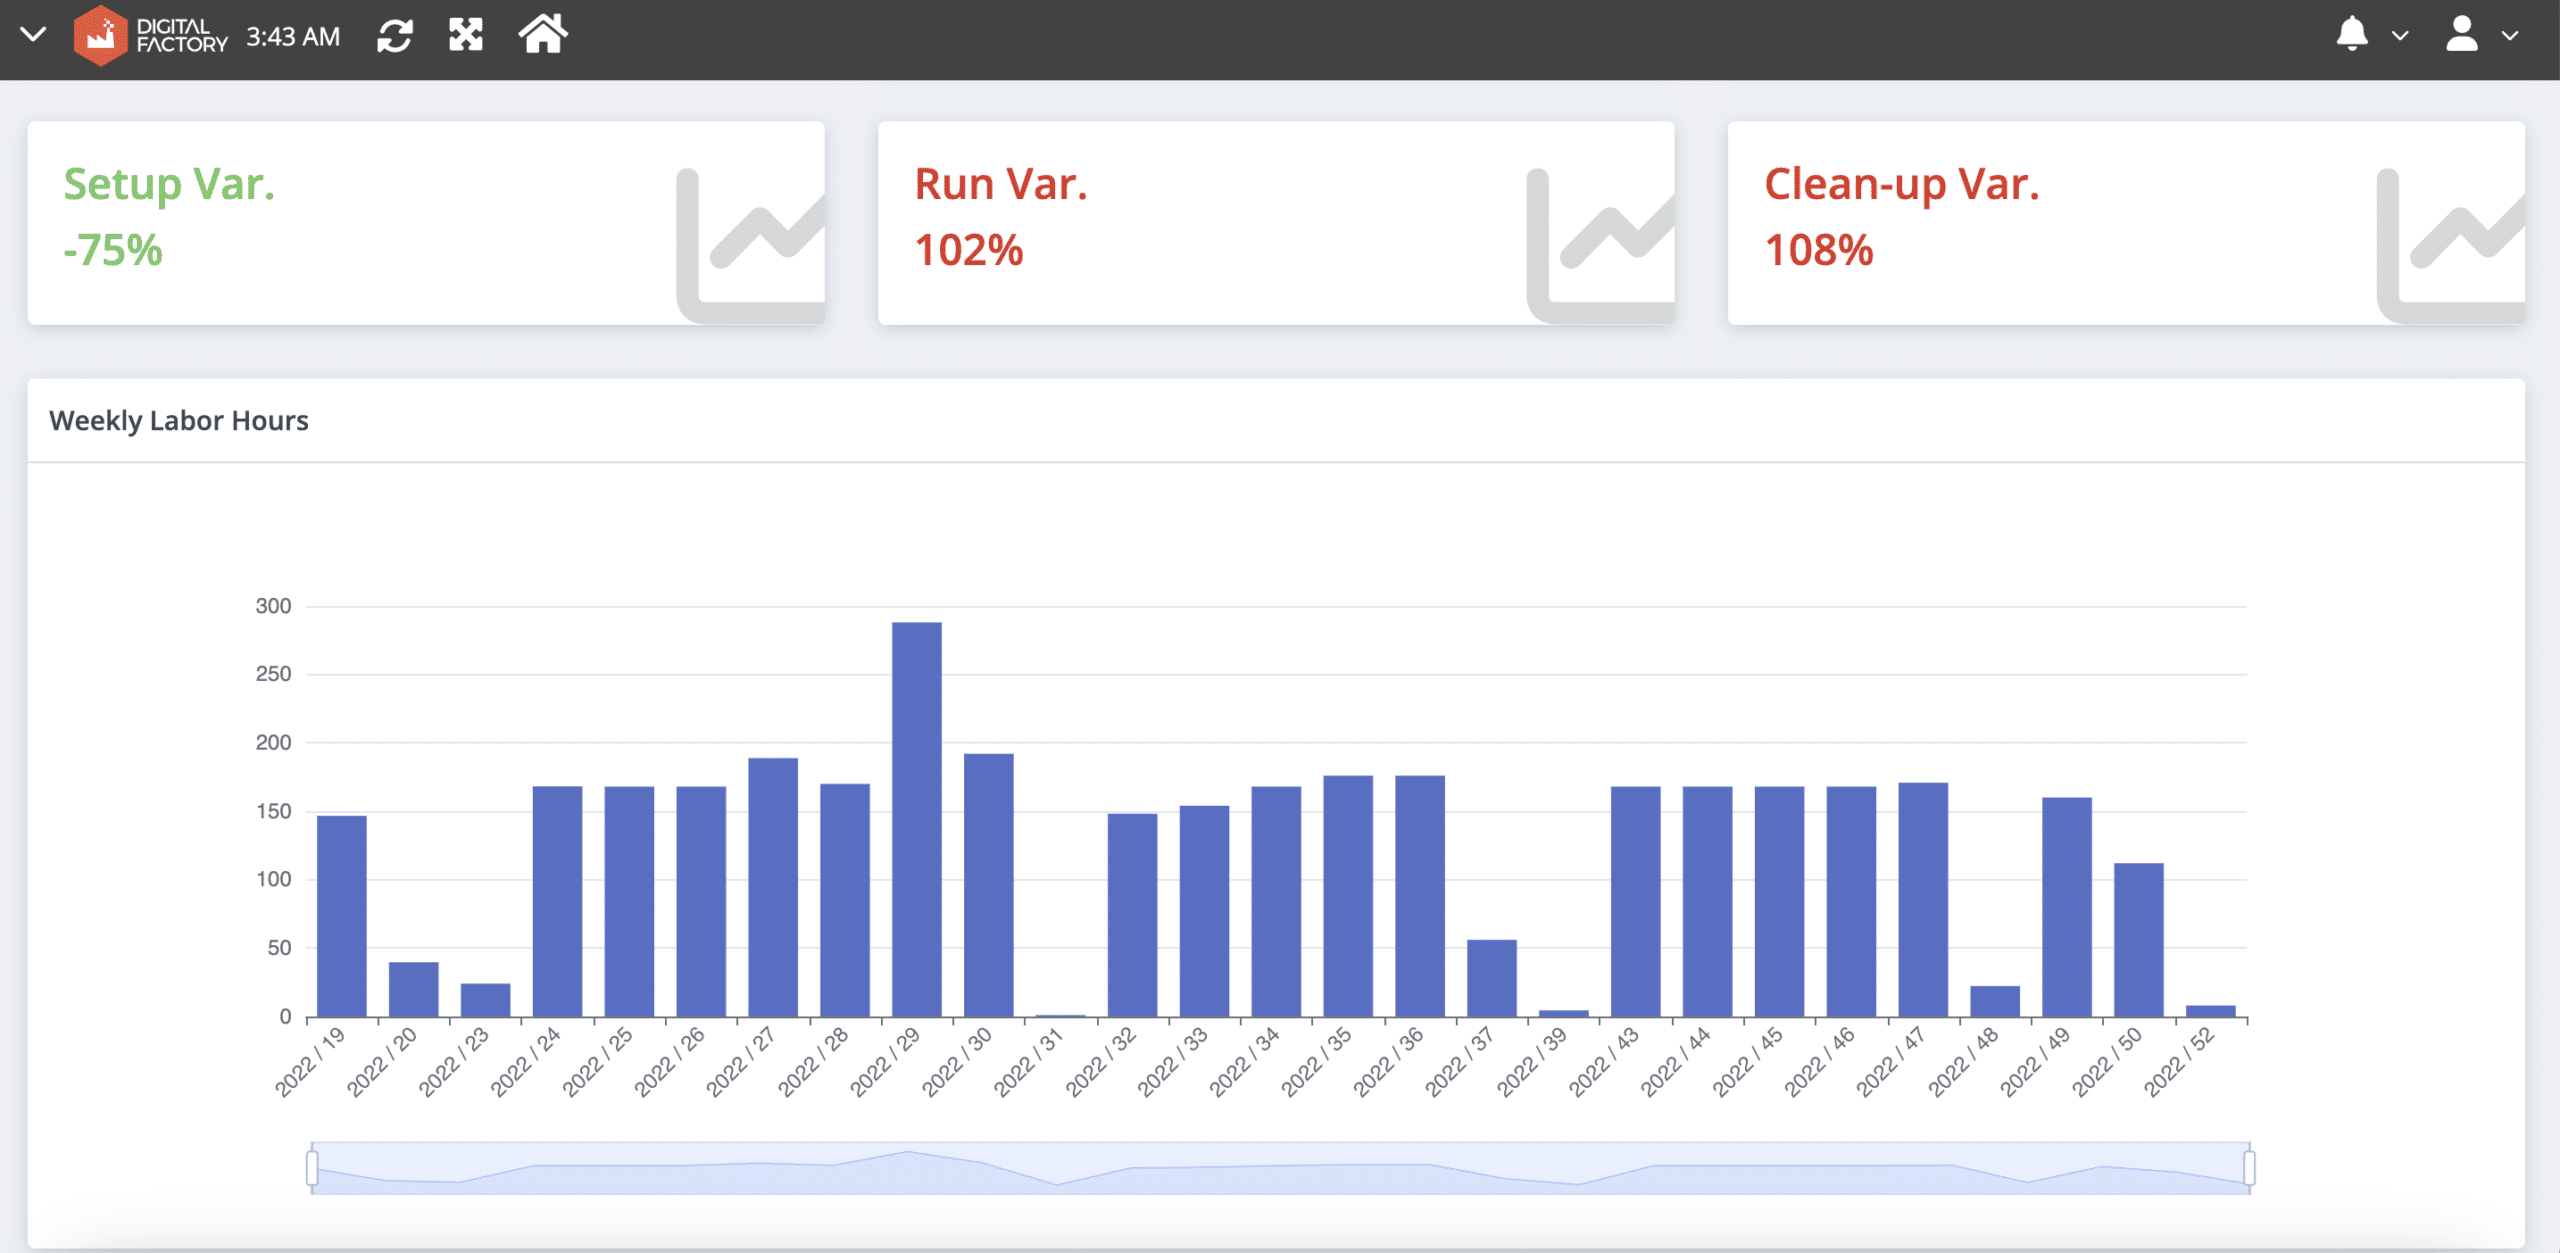
Due to the ongoing labor shortage in the manufacturing industry, factory leaders must utilize their workforce effectively. One way to achieve this is by understanding how much specific employees work on the shop floor and identifying targeted training opportunities to maximize their performance. The Labor Performance Report provides real-time data for conducting such analysis.
For instance, the employee below performs better than the targeted set-up time, indicating that no additional training is needed in this area. However, their clean-up duration is longer than the target, suggesting that targeted training for this task would be beneficial.
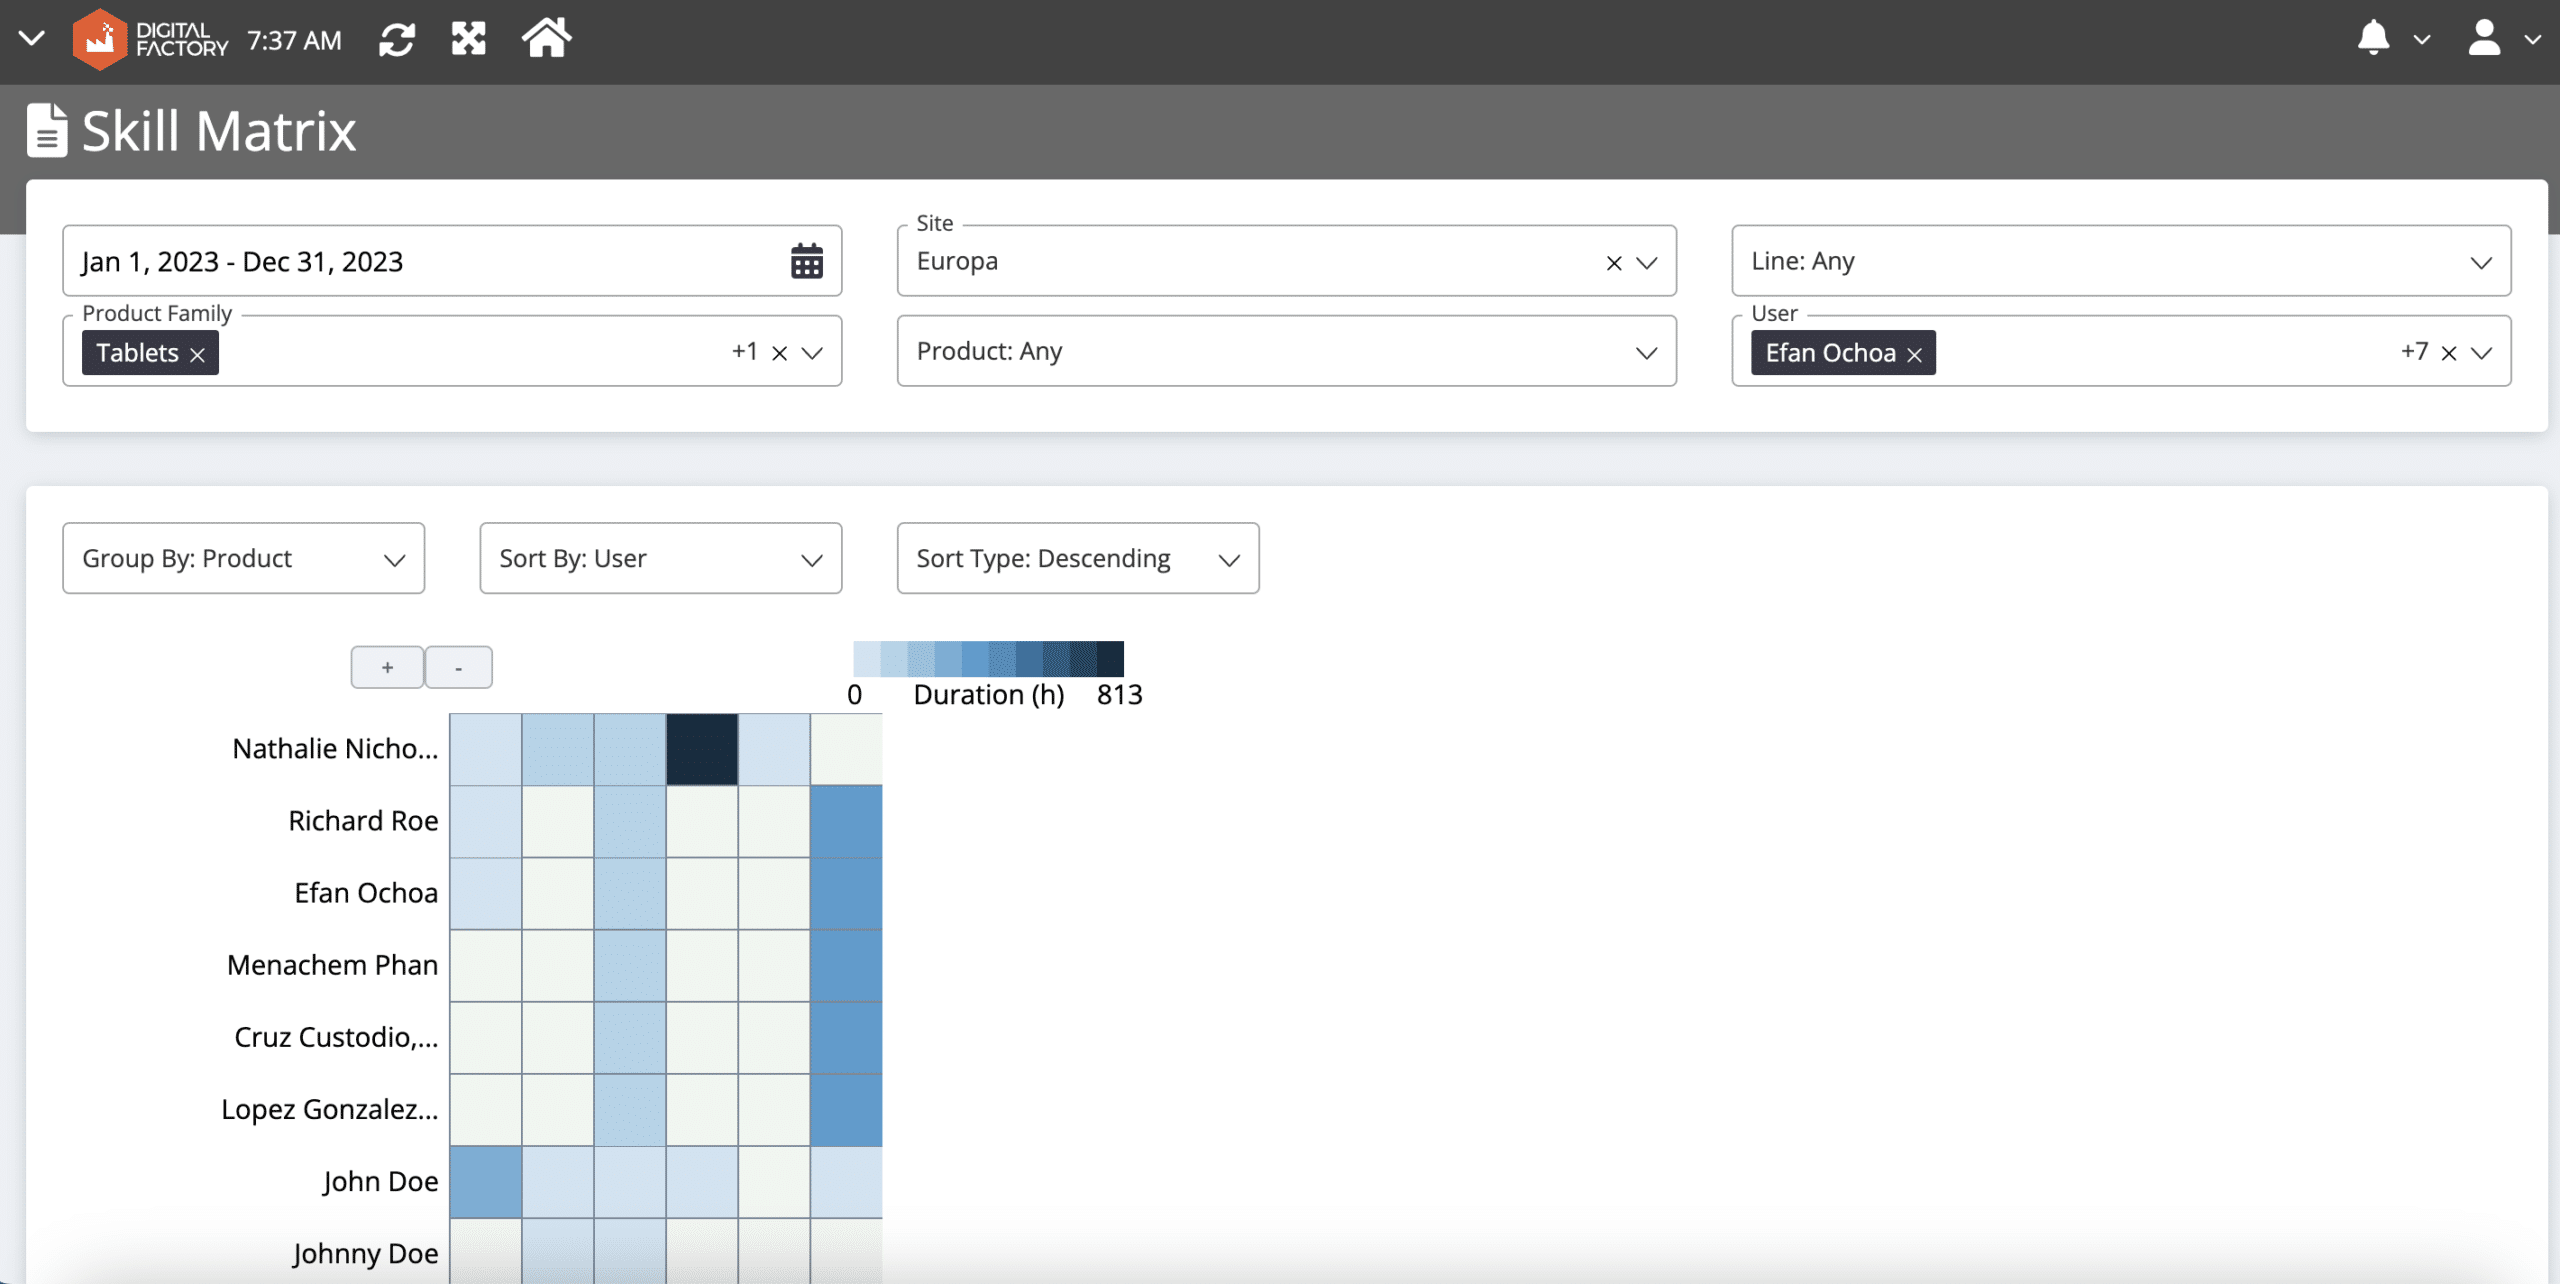
10. Labor Skill Matrix
Another way to maximize the return on labor is by understanding the strengths and weaknesses of workers and assigning them to tasks accordingly. Labor Skill Matrices provide detailed information on workers’ experience with different product families, specific products, or tasks. This allows manufacturers to assign the most suitable worker for each job, ensuring optimal performance.
Best Practices for Selecting Right Manufacturing Analytics
When selecting a manufacturing analytics solution, managers should consider the following best practices to ensure the solution aligns with their business needs and provides maximum value:
- Match with Your Business Goals: Ensure the analytics solution aligns with your specific business objectives. For instance, if your goal is to improve OEE and the provider focuses on other metrics, it is best to look for a different provider.
- Industry Match: Check case studies and references from manufacturing analytics providers. Different industries have unique compliance requirements and operational dynamics. It is advisable to work with a company that has proven experience in your specific industry.
- Scalability: Choose a solution that can scale with your changing business needs. Cloud manufacturing solutions generally offer high scalability, allowing you to expand or adjust the solution as required.
- Data Security: Assess the vendor’s data security practices, such as role management control, two-factor authentication, and compliance with standards like ISO 27001. Ensuring robust data security is critical for protecting sensitive information.
- Quality of Customer Success Team: The effectiveness of your manufacturing analytics solution depends significantly on the support from the technology vendor. Check customer testimonials and understand the vendor’s customer success policies to ensure you will receive the necessary support.
- Time to Implementation: For cloud manufacturing analytics, the implementation time is generally less than 100 days, allowing you to quickly benefit from enhanced visibility. Low/no-code solutions or in-house developments may have longer implementation times, delaying the realization of benefits.
- Cost: Cloud manufacturing analytics solutions tend to be cheaper since they do not require investment in servers and other hardware. Additionally, leveraging the vendor’s IT team and code writers can further reduce costs.
SCW.AI’s Cloud Based Manufacturing Analytics Software
Throughout this article, all images and videos mentioned in the use cases belong to SCW.AI’s manufacturing analytics solutions. Our cloud-based Digital Factory Platform offers a comprehensive industry 4.0 transformation, particularly for regulated industries such as pharmaceuticals and food and beverage.
If you have further questions about our solutions, do not hesitate to contact us.
For detailed information on our Digital Factory Platform and to see how it can benefit your operations, you can book a demo now.