Productivity in manufacturing is shaped by the effective use of labor, capital, raw materials, and energy—coordinated through strategic organization. While each of these factors contributes to performance gains, labor productivity remains one of the most underutilized levers for achieving world-class results. Historically, the challenge has been the lack of precise, actionable insights into labor efficiency. But with the rise of labor analytics and the broader adoption of Industry 4.0 technologies, manufacturers now have unprecedented visibility into this critical area.
Our experience, supported by industry data, shows that poor labor productivity often triggers a self-reinforcing cycle of operational inefficiencies. It starts with shadow hours and unmet targets, which lead to increased overtime. That overtime accelerates burnout and drives higher turnover. New hires take time to ramp up, further lowering productivity—and the cycle repeats. The gap between paid hours and productive hours widens, creating a drag on throughput and margins.

This article explores how to break that cycle. We will start by outlining how labor productivity can be measured in today’s digital manufacturing environment. Next, we will examine recent statistics to help industry leaders to be aware of long lasting trends. Finally, we will lay out six actionable strategies to improve labor productivity—rooted in data, operational precision, and human capital investment—to drive resilience and profitability across your manufacturing operations.
Understanding Labor Productivity in Manufacturing
Labor productivity in manufacturing refers to how efficiently and effectively employees complete their assigned tasks—both in terms of time and output quality. This applies across direct production activities and indirect roles that impact overall shop floor performance.
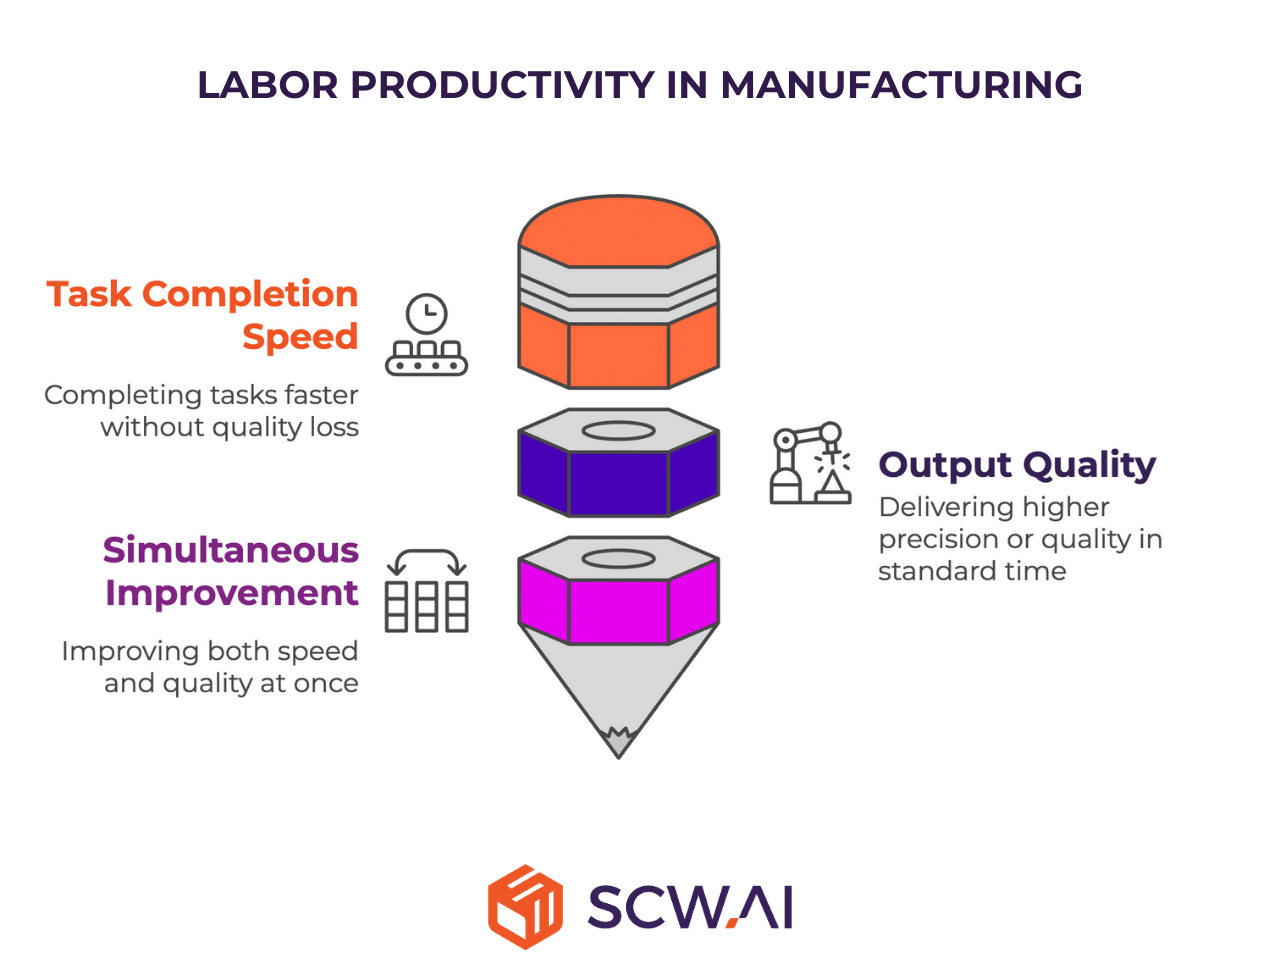
Improvements in labor productivity may manifest in several ways:
- Completing defined tasks faster without compromising quality.
- Delivering higher precision or quality within standard timeframes.
- Improving both speed and quality simultaneously.
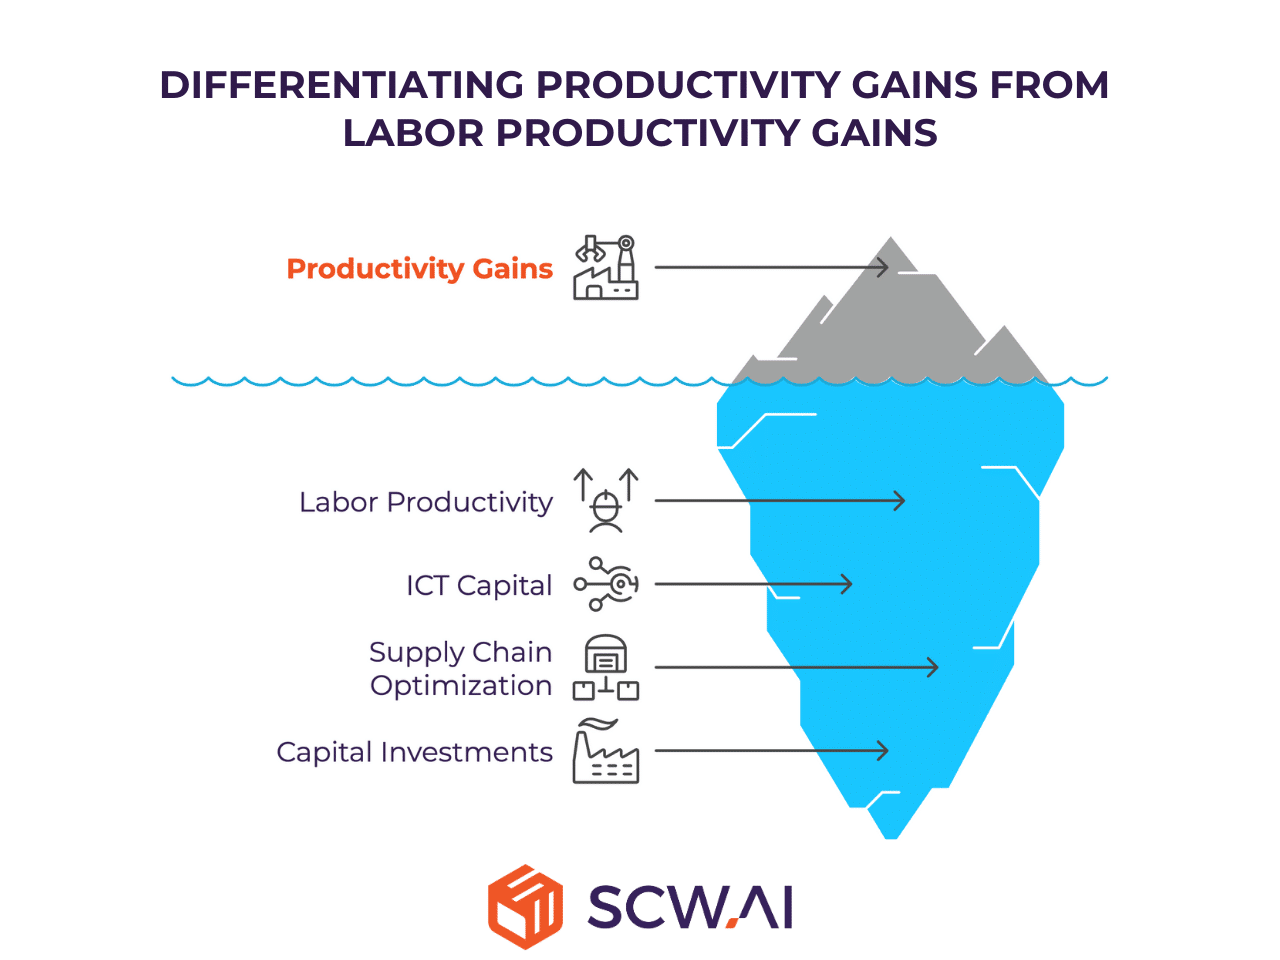
This nuanced perspective is crucial for isolating the impact of labor on productivity gains, distinguishing it from improvements driven by capital investments, supply chain optimizations, or other factors. The traditional metric of “output per labor hour,” while seemingly straightforward, can be misleading in modern manufacturing environments. Increases in output may be primarily attributable to advancements in automation or optimized material flow, without necessarily reflecting changes in the efficiency of the workforce itself.
Why Output per Labor Hour Fall Short
Consider a manufacturer grappling with bottlenecks caused by changeover activities, specifically line cleaning and machine setup. The implementation of an AI-powered production scheduling system, designed to minimize the frequency of major changeovers by strategically sequencing similar product families, yields the following results:
- Changeover Duration Reduction: 35% (attributable to fewer major changeovers)
- Availability Loss Decrease: 21%
- OEE Improvement: from 50% to 55%
If these gains are entirely channeled into increased throughput, the resulting output increases by 10%. A conventional “output per labor hour” calculation would incorrectly suggest a corresponding 10% improvement in labor productivity. However, the reality is that the duration of individual changeover tasks remains unchanged; the productivity gain is a direct consequence of the ICT (Information and Communication Technology) capital investment optimizing production scheduling, not an enhancement in the efficiency of operator productivity
Contrast this with a scenario where operators, without AI intervention, manage to complete changeovers 10% faster. In this case:
- Reduction in changeover duration is now only 10% (compared to the AI-driven 35%), the subsequent impact on output increase is also proportionally smaller, estimated at around 3%. Thus, with output per labor hour calculation labor productivity increases become 3%.
- Crucially, true labor productivity has improved by 10%, as the time required for operators to perform the same scope of changeover tasks with the same quality has demonstrably decreased.
This highlights a critical point: Labor productivity improvements require measuring individual task efficiency—not just total output.
Furthermore, in the AI-driven scheduling example, there is a labor productivity gain—but within the planning team. If planners once needed 8 hours to create a schedule yielding 50% OEE, and now generate higher OEE schedules faster through AI assistance, their productivity has genuinely improved through digital augmentation.
Calculating Labor Productivity in the Digital Age
In the digital age, a more accurate and insightful approach to calculating labor productivity in manufacturing involves measuring the difference between planned and actual task completion times, while also considering the achieved level of accuracy or quality.
This method captures productivity even in non-output tasks and enables targeted interventions across all levels of the workforce. The foundation for this is advanced labor analytics, enabled by tools like Labor Performance Reports.
Key Features of Labor Analytics Systems
These systems integrate real-time worker data with broader factory operations, providing a comprehensive view of workforce performance. When an operator logs into a line, the system recognizes their activity type (e.g., setup, production, cleanup) and tracks the corresponding KPIs:
- Setup Variance: Planned vs. actual time for setup tasks
- Runtime Variance: Deviation from scheduled production runtimes
- Cleanup Variance: Time difference between expected and actual post-run activities

These insights can be aggregated by individual, team, shift, or plant-level, unlocking valuable patterns:
- Actual vs. Planned Task Duration: Pinpoint where processes deviate from benchmarks
- Historical Trends: Track performance improvements or declines over time
- Team Comparisons: Benchmark between shifts or teams doing similar work
- Underperformance Detection: Identify workers or teams that routinely fall behind targets or their colleagues performance
- Top Performer Identification: Spot high-efficiency workers for recognition, training, or skilled based labor scheduling.

The Vicious Cycle of Manufacturing Labor Productivity: An Analytical Narrative
The concept of a vicious cycle—a self-reinforcing negative loop—is well established in both development economics and industrial operations. In manufacturing, labor productivity often falls victim to such a dynamic. The symptoms may vary across organizations, but the underlying mechanics are strikingly consistent.
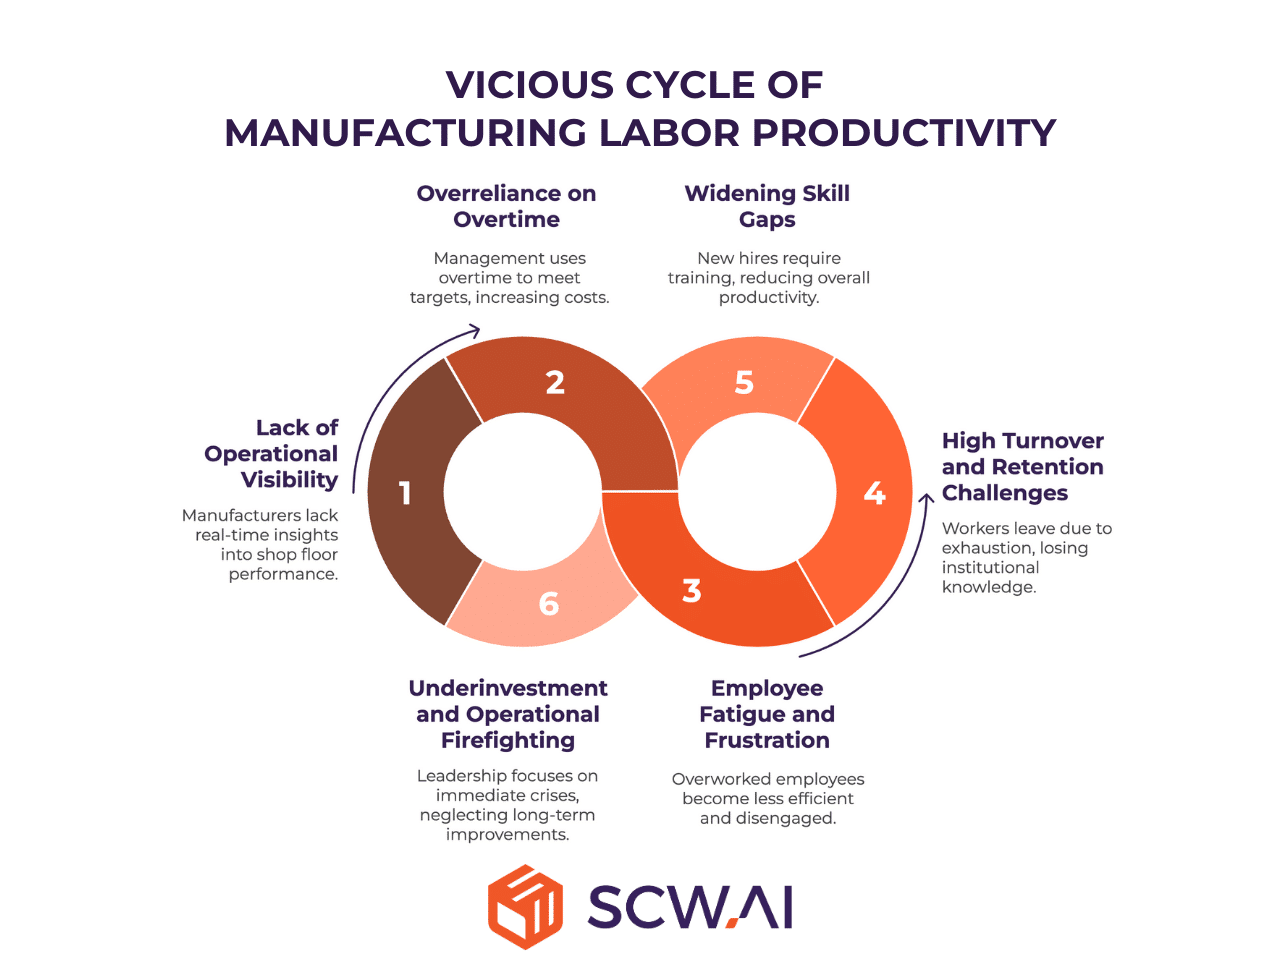
Here is how the cycle typically unfolds:
- Lack of Operational Visibility: Many manufacturers operate without real-time, task-level insights into shop floor performance. Without this data, issues like unplanned downtime, inefficient workflows, and shadow hours—time when employees are present but not productively engaged—go undetected. These inefficiencies slowly reduce productivity across both labor and capital resources.
- Overreliance on Overtime: When throughput lags and OTIF (On-Time In-Full) delivery targets are at risk, management often defaults to overtime to close the gap. While this may offer short-term relief, it drives up labor costs significantly due to premium pay requirements—and masks deeper systemic issues rather than resolving them.
- Employee Fatigue and Frustration: Sustained overtime leads to physical and mental fatigue. Overworked employees become less efficient, make more errors, and disengage from continuous improvement efforts. As morale drops, so does the quality of output per labor hour.
- High Turnover and Retention Challenges: Exhaustion and dissatisfaction accelerate attrition. Workers leave before reaching full proficiency, creating a revolving door effect on the shop floor. Institutional knowledge and hard-earned efficiencies walk out with them.
- Widening Skill Gaps: New hires require onboarding and ramp-up time. Until they reach full productivity—often months later—the team’s overall performance dips further. Senior operators must absorb the training load, further stretching thin resources.
- Underinvestment and Operational Firefighting: Persistent labor inefficiencies and the associated costs (overtime, rework, lost throughput) erode profit margins. Faced with thin budgets and chronic performance issues, leadership deprioritizes long-term investments like automation, process upgrades, or labor upskilling. Instead, managers are forced into reactive mode—solving day-to-day crises instead of building long-term capability.
- Reinforcement of the Cycle: With each loop, the system degrades further. Workforce instability compounds inefficiency. The skill base weakens. Management is left reacting, not leading. Without deliberate intervention, the organization remains trapped in this cycle—bleeding resources, losing productivity, and falling behind competitors.
Recent Labor and Labor Productivity Related Statistics
This section highlights key statistics concerning labor and labor productivity within the manufacturing sector, providing empirical evidence that supports our analytical narrative of the vicious cycle and underscores the persistent nature of labor productivity challenges since the early 2010s.
30% to 50% Gap Between Paid vs. Productive Hours
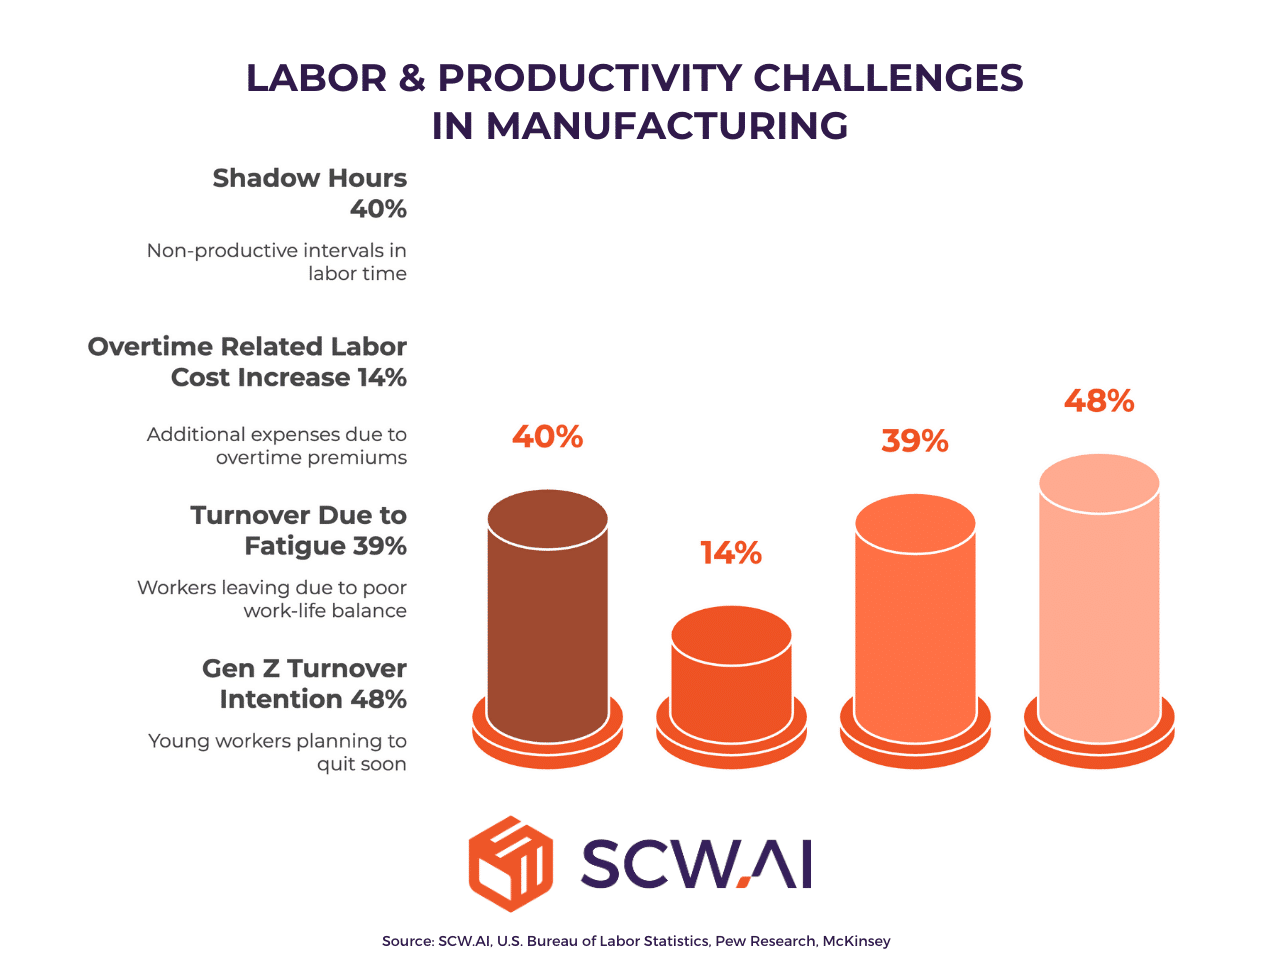
Our industry observations consistently reveal a significant gap between paid hours and productive labor. Known as shadow hours, these non-productive intervals typically account for 30% to 50% of total paid labor time in manufacturing environments.
Overtime Adds 14%+ to Labor Costs Without Solving Root Problems
According to the U.S. Bureau of Labor Statistics, as of April 2025, the average manufacturing worker logs 3.7 hours of overtime per month. This equates to at least a 14% increase in labor costs, driven by overtime premiums. While this temporarily offsets production shortfalls, it masks deeper productivity issues and compounds financial pressure over time.
Overtime Fatigue Is Fueling Turnover for 39% of Workers
Fatigue from excessive hours is a leading cause of employee dissatisfaction. Pew Research Center data shows that 39% of workers who resigned cited poor work-life balance and long hours as key reasons. This data links directly to the third stage of the vicious cycle—where employee burnout and disengagement erode productivity and lead to costly exits.
≅50% of Gen Z Manufacturing Workers Plan to Quit in 3–6 Months
Generational workforce shifts are exacerbating the retention crisis. A McKinsey survey reports that 48% of Gen Z employees in manufacturing expect to leave their roles within three to six months. These frequent departures destabilize operations, create constant hiring demands, and leave knowledge gaps that directly impact shop floor performance.
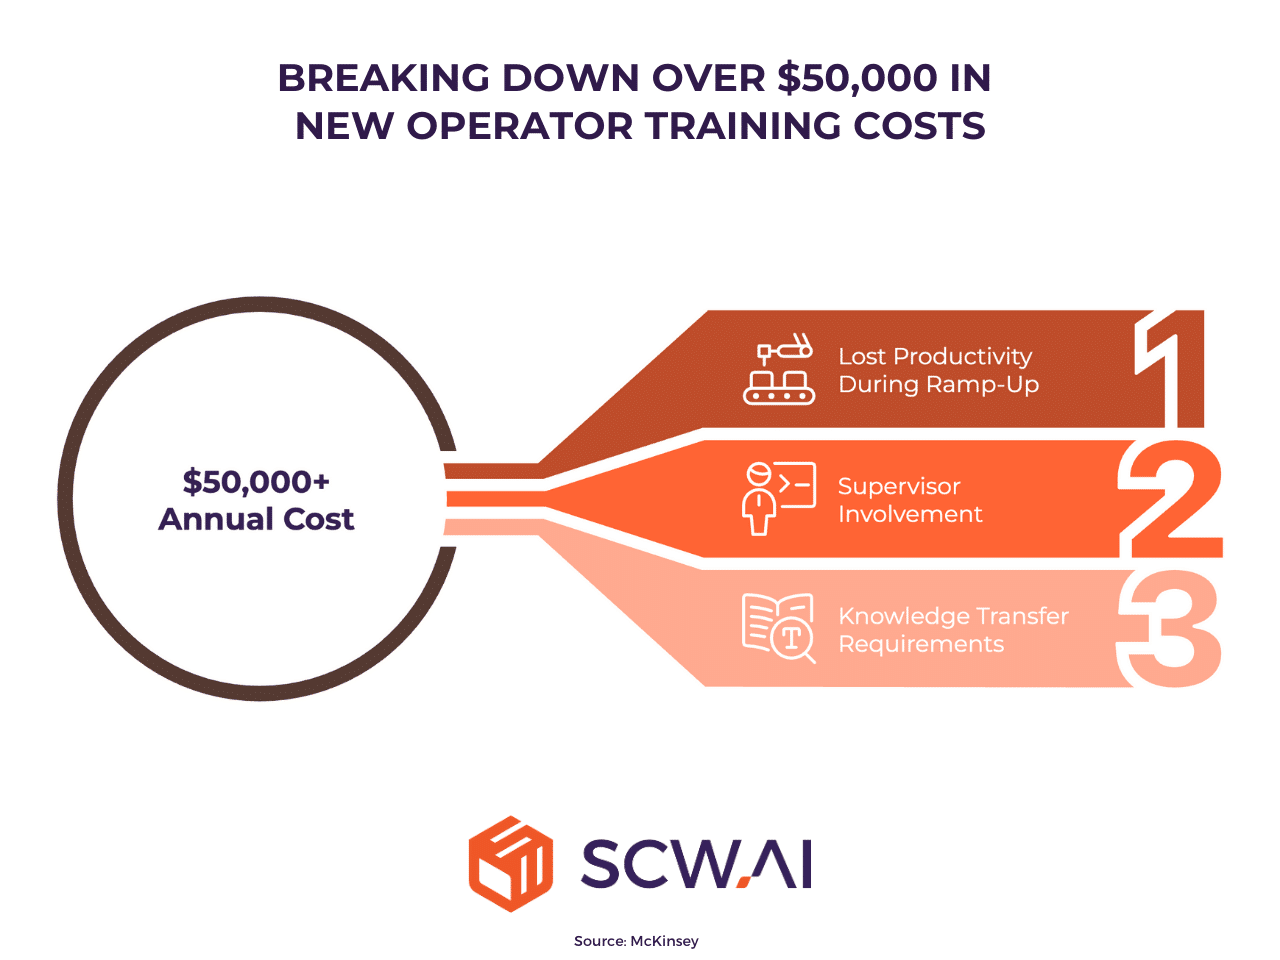
$50,000+ Annual Cost of Training New Operators
McKinsey estimates that training a new shop floor operator costs over $50,000 annually, considering lost productivity during ramp-up, supervisor involvement, and knowledge transfer requirements.
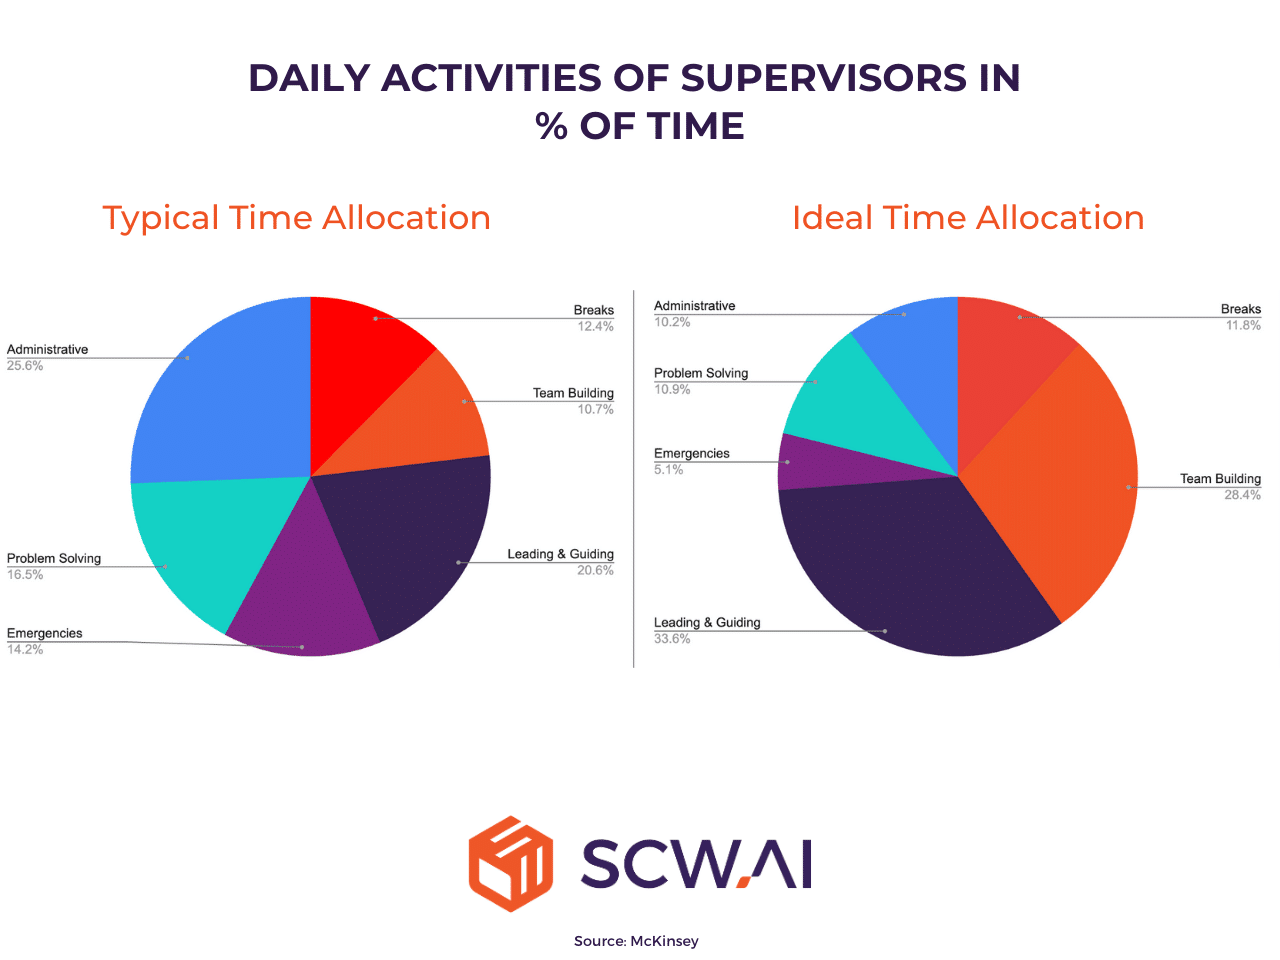
Supervisors Spend 60% of Time Reacting Instead of Leading
Frontline leadership is also compromised. McKinsey data shows that only 30% of supervisor time is spent on leading activities like team building, process confirmation, and operator development. The remaining 70% is consumed by firefighting administrative tasks and breaks—leaving little bandwidth to drive sustained performance improvement.
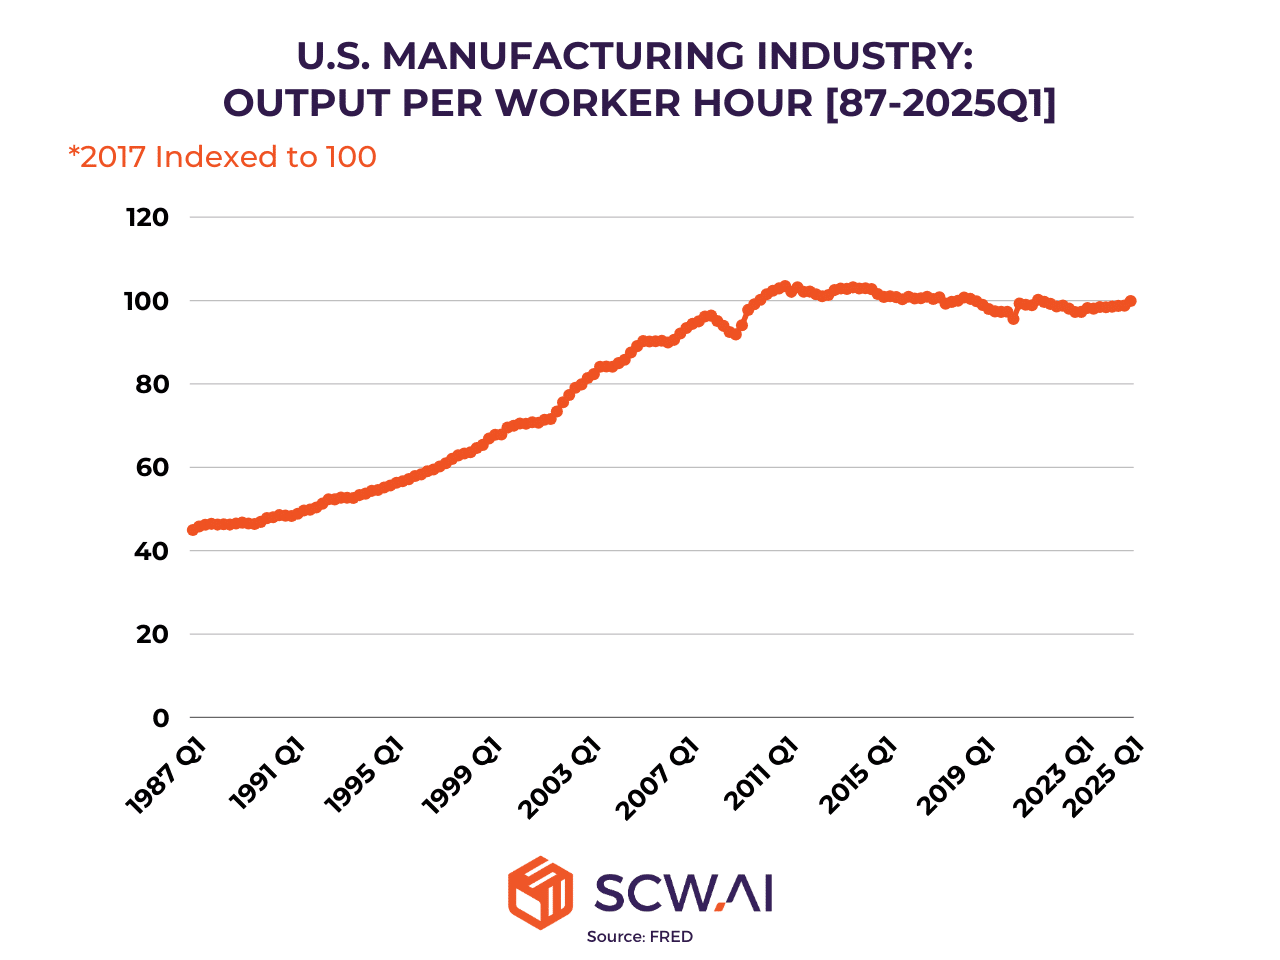
Labor Productivity Has Flatlined Since 2010
Looking at the broader economic landscape, data from the Federal Reserve Economic Data (FRED) reveals a concerning stagnation in labor productivity within the U.S. manufacturing sector since 2010. Indexing output per labor hour to 100 in 2017, the value in 2010 stood at 100.1, while the figure for the first quarter of 2025 was 99.9. This contrasts sharply with the pre-2010 period, where output per labor hour showed consistent growth. For instance, the index was 89.1 in Q1 2005, 70 in Q1 2000, and 47.9 in Q1 1990.
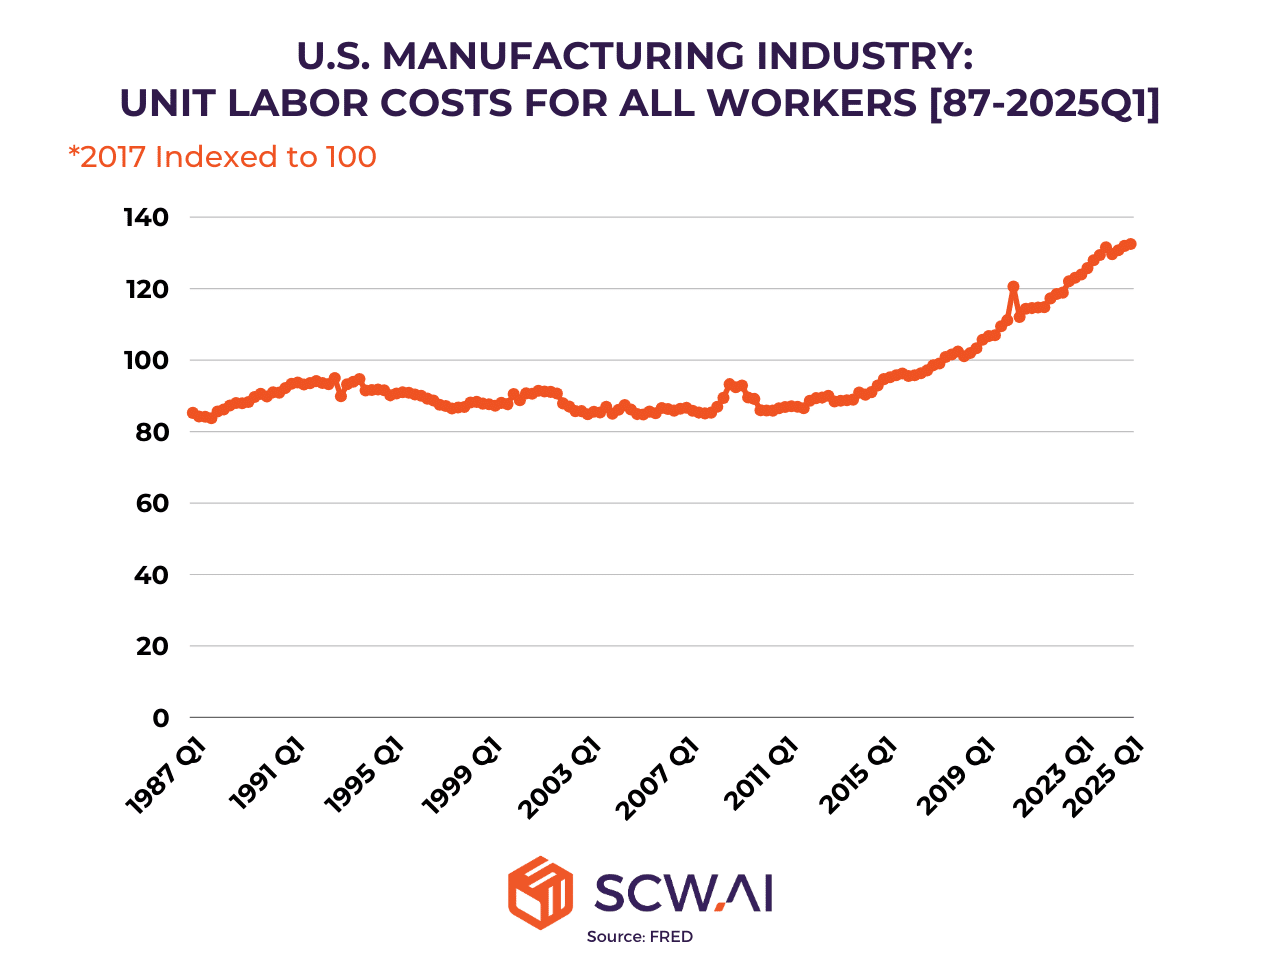
Unit Labor Costs Are Rising Faster Than Output
Adding to the economic concern, despite stagnant labor productivity, unit labor costs in U.S. manufacturing have increased at a faster rate in the post-2010 period compared to the years preceding it, according to FRED. With 2017 indexed at 100, the unit labor cost reached 132.5 in Q1 2025, compared to 111.1 in Q1 2020, 86 in Q1 2010, 90.5 in Q1 2000, and 89.8 in Q1 1990. This divergence between stagnant productivity and rising costs further exacerbates the financial pressures on manufacturers.
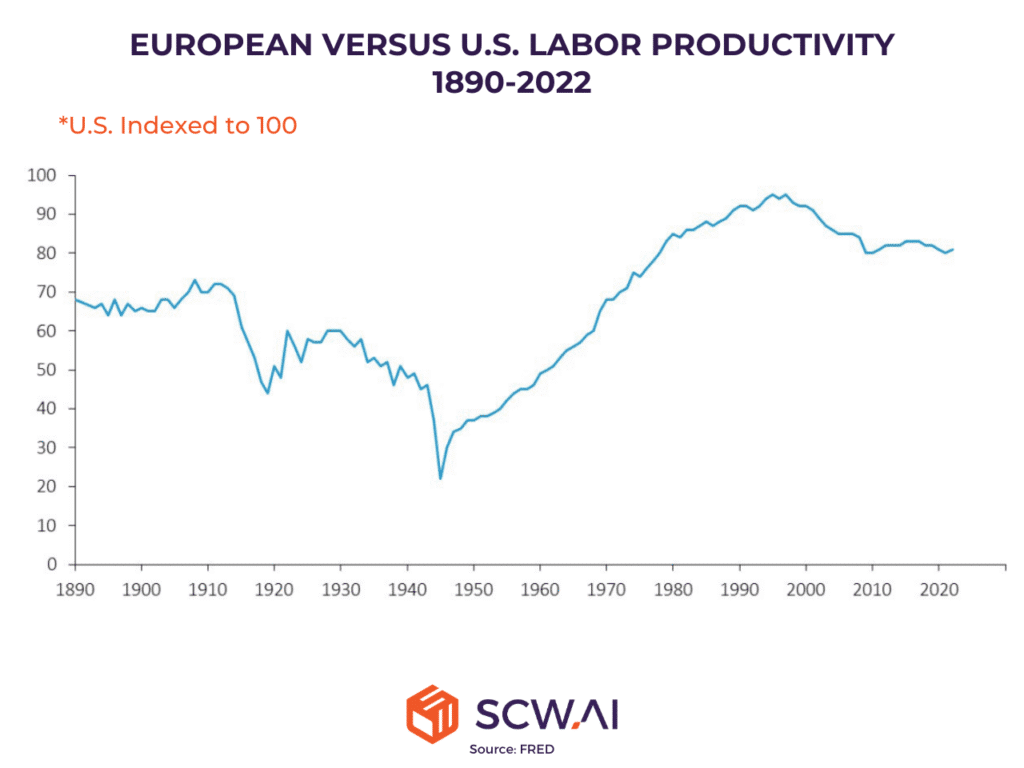
Labor Productivity Decline Is a Global Concern
The U.S. is not alone in facing these challenges. A 2024 report led by Mario Draghi for the European Commission found that labor productivity in the European Union has declined compared to the U.S.. This suggests a broader trend across regions, where similar pressures are limiting operational agility and efficiency.
Finally, it is crucial to recognize that labor productivity issues pose a particularly significant bottleneck for factories in developed countries. This is primarily due to the relatively higher cost of hourly labor compared to other operational expenses, such as the cost of energy, in regions like the U.S., EU, Canada, and Singapore, when compared to countries like Indonesia, India, and Mexico.
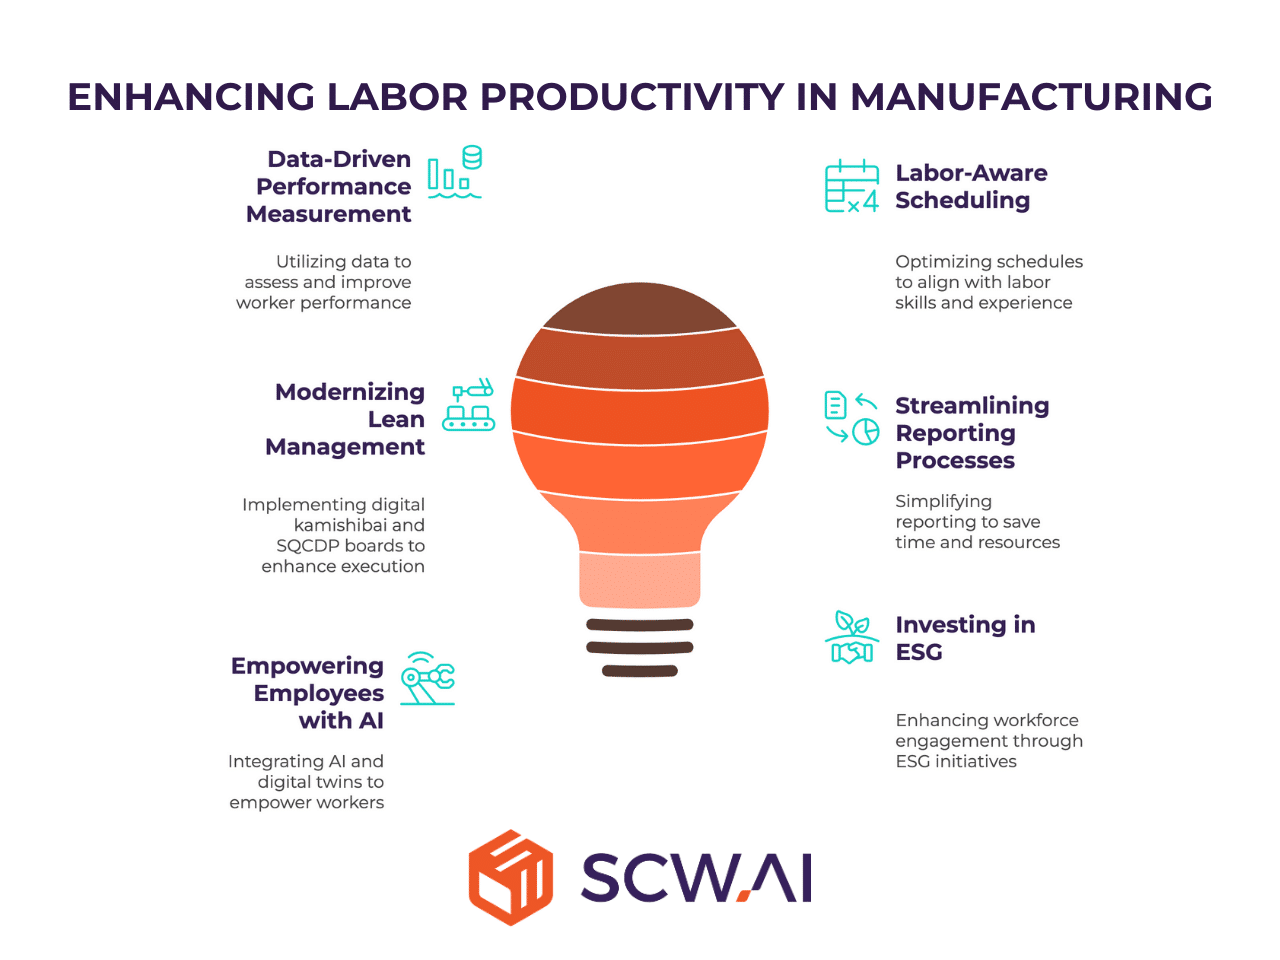
6 Ways to Improve Labor Productivity in Manufacturing
This section outlines six targeted strategies manufacturers can adopt to enhance workforce productivity—whether by reducing task durations, improving quality, or achieving both simultaneously.
1. Data-Driven Performance Measurement for Workers
Precision starts with visibility. Real-time labor analytics offer a detailed view of workforce performance, enabling:
- Monitoring of active vs. unproductive hours (reducing shadow time)
- Identification of individual skill gaps
- Benchmarking across shifts or teams
- Recognition of high performers
With this data, manufacturers can move from reactive oversight to proactive workforce optimization.
2. Implementing Labor-Aware Scheduling
Static scheduling tools often ignore operator skill levels, leading to inefficiencies. A real-time Digital Skill Matrix, integrated with AI scheduling engines, allows:
- Filtering: Assigning only qualified workers to critical tasks
- Scoring: Prioritizing based on recent task performance
- Learning: Adapting schedules to individuals’ skill progression
This ensures optimal labor allocation and fewer errors.

3. Modernize Your Lean Management Strategies
Lean management tools like Kamishibai and SQCDP boards have long been valuable—but their paper-based versions are static and labor-intensive. Transitioning to digital versions improve shop floor execution
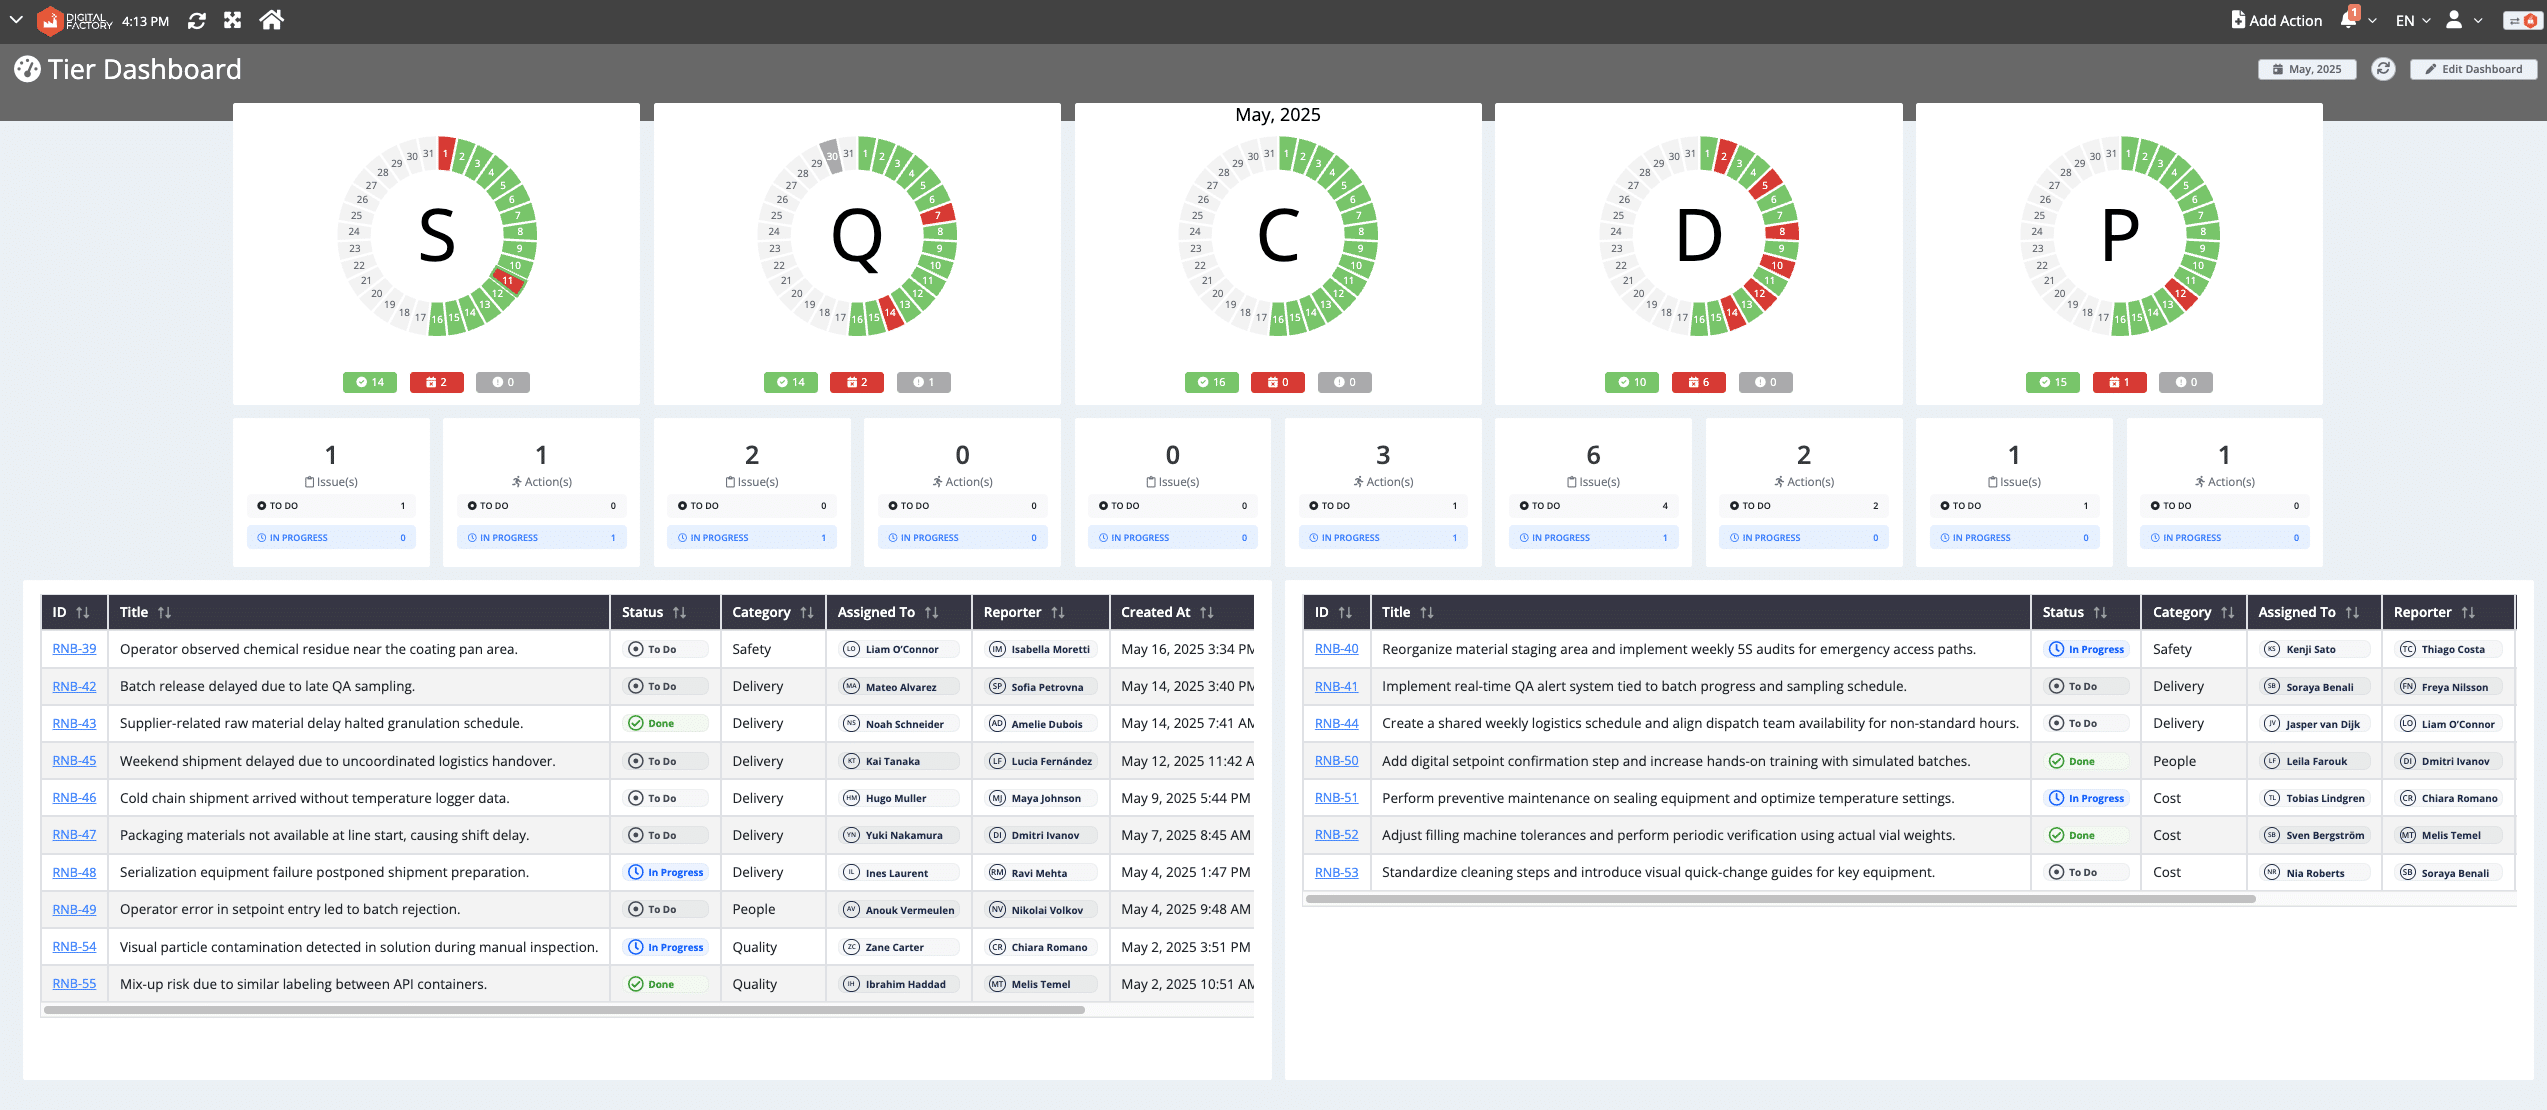
Digital SQCDP boards (Action Tracker) integrate with factory systems to highlight deviations across safety, quality, cost, delivery, and people metrics—streamlining daily meetings and focusing attention where it matters.
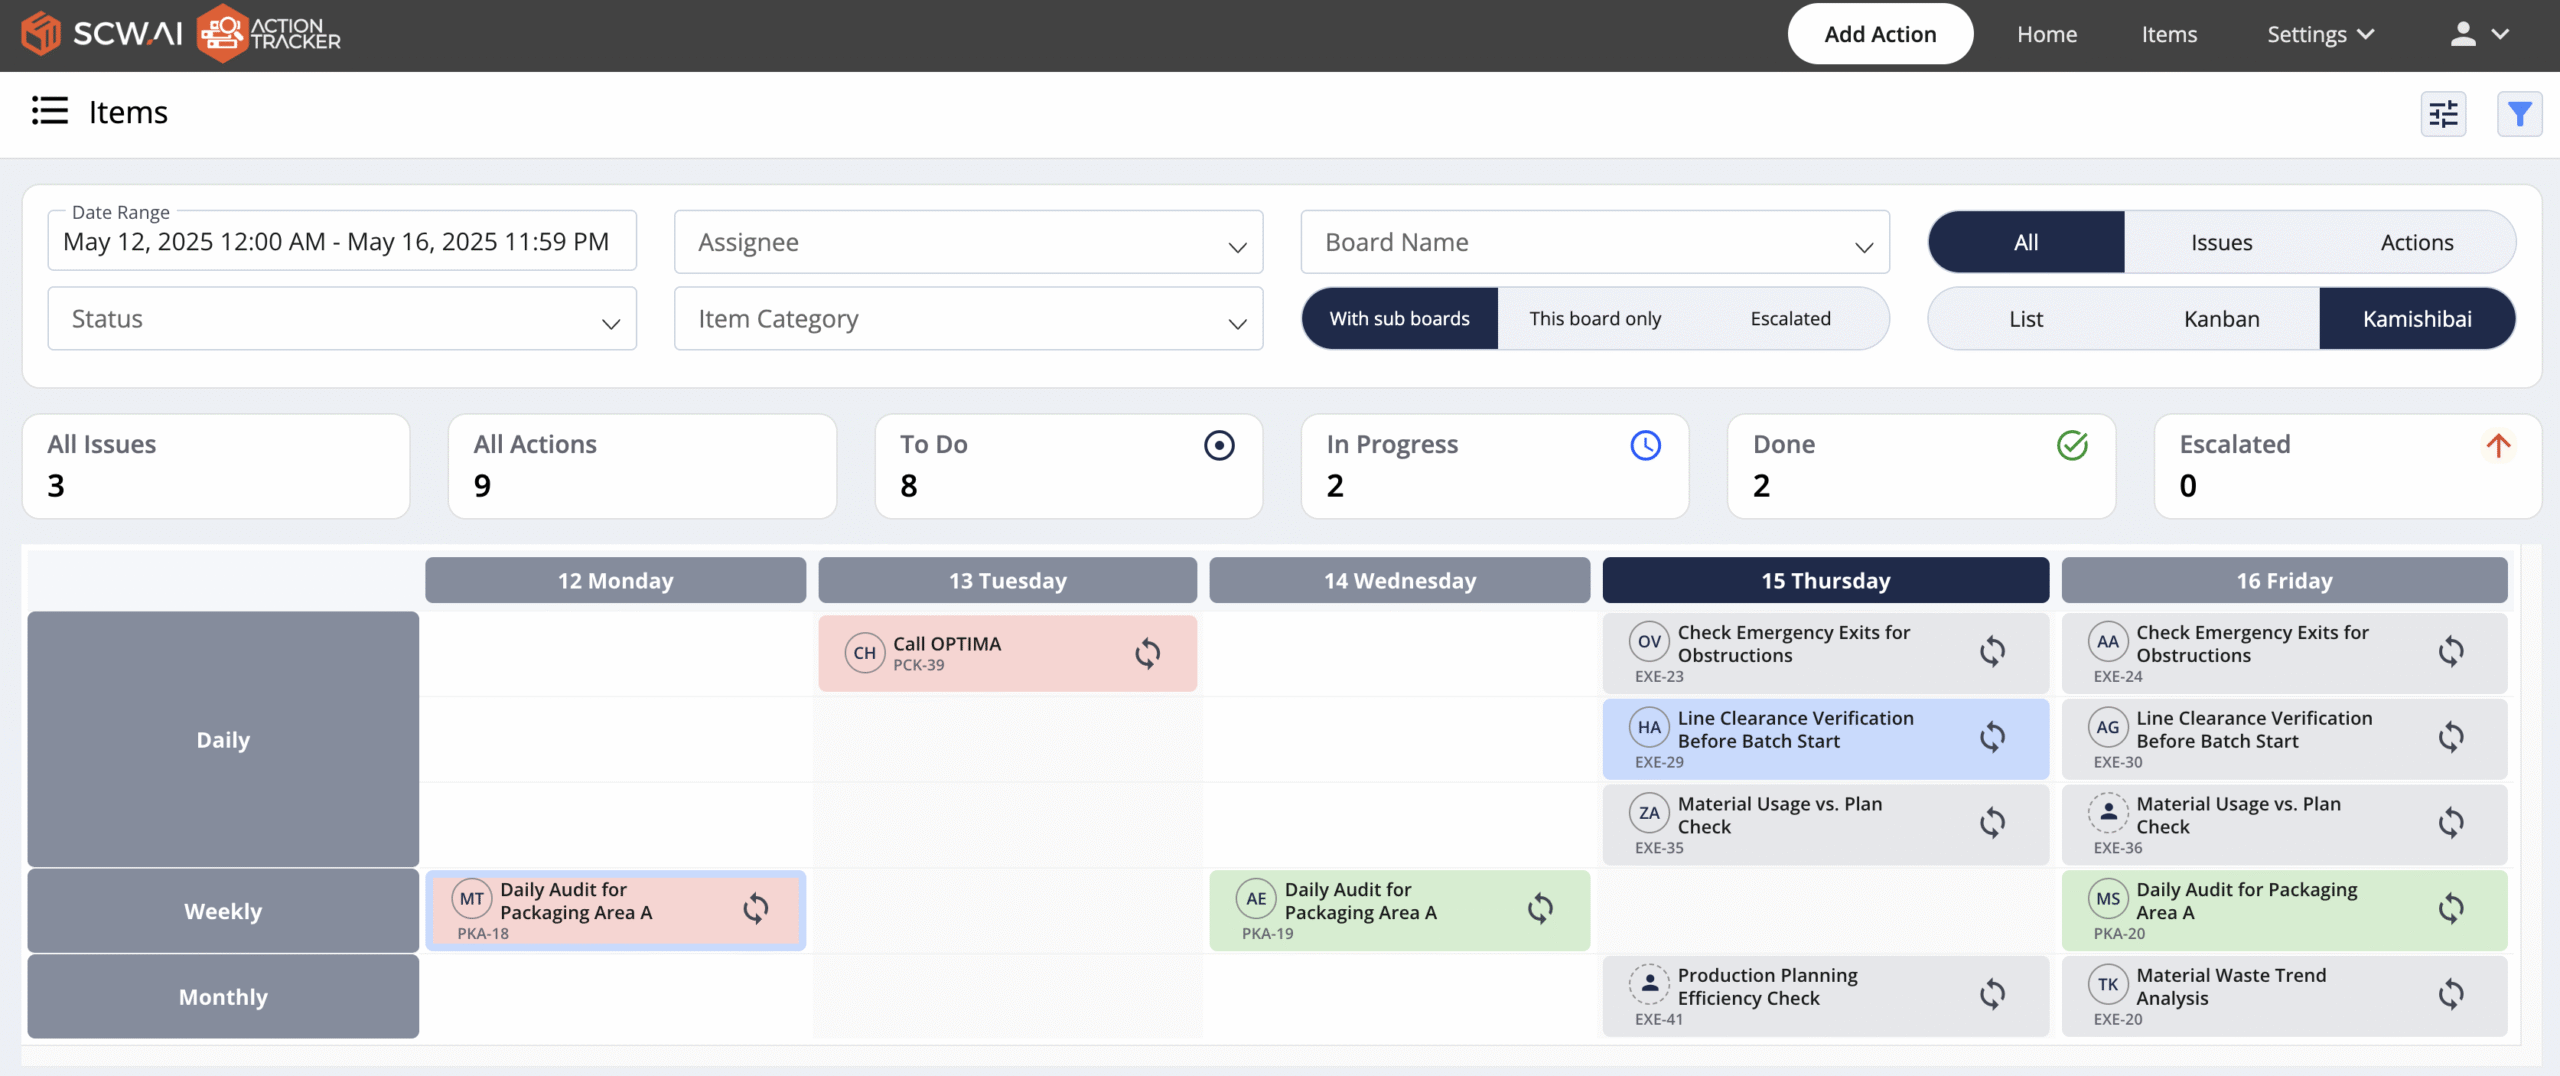
Digital Kamishibai boards bring clarity to task assignments and accountability. Most importantly, these tools support embedded SOPs that go beyond text: operators access videos, images, checklists, and job aids directly linked to each task. This reduces variability and ensures consistent task execution, even with less experienced staff.
4. Streamlining Reporting Processes

Supervisors often spend a disproportionate share of their time creating reports—a task that adds little direct value to operations. In environments lacking real-time systems, pulling KPI data like OEE, capacity utilization, or first-pass yield can take hours.
With modern analytics platforms, this information becomes instantly accessible. Dashboards present real-time insights on line performances, assets and people. AI further automates routine reporting through scheduled alerts, performance summaries, and escalation triggers.
5. Empowering Employees with Manufacturing AI and Digital Twins
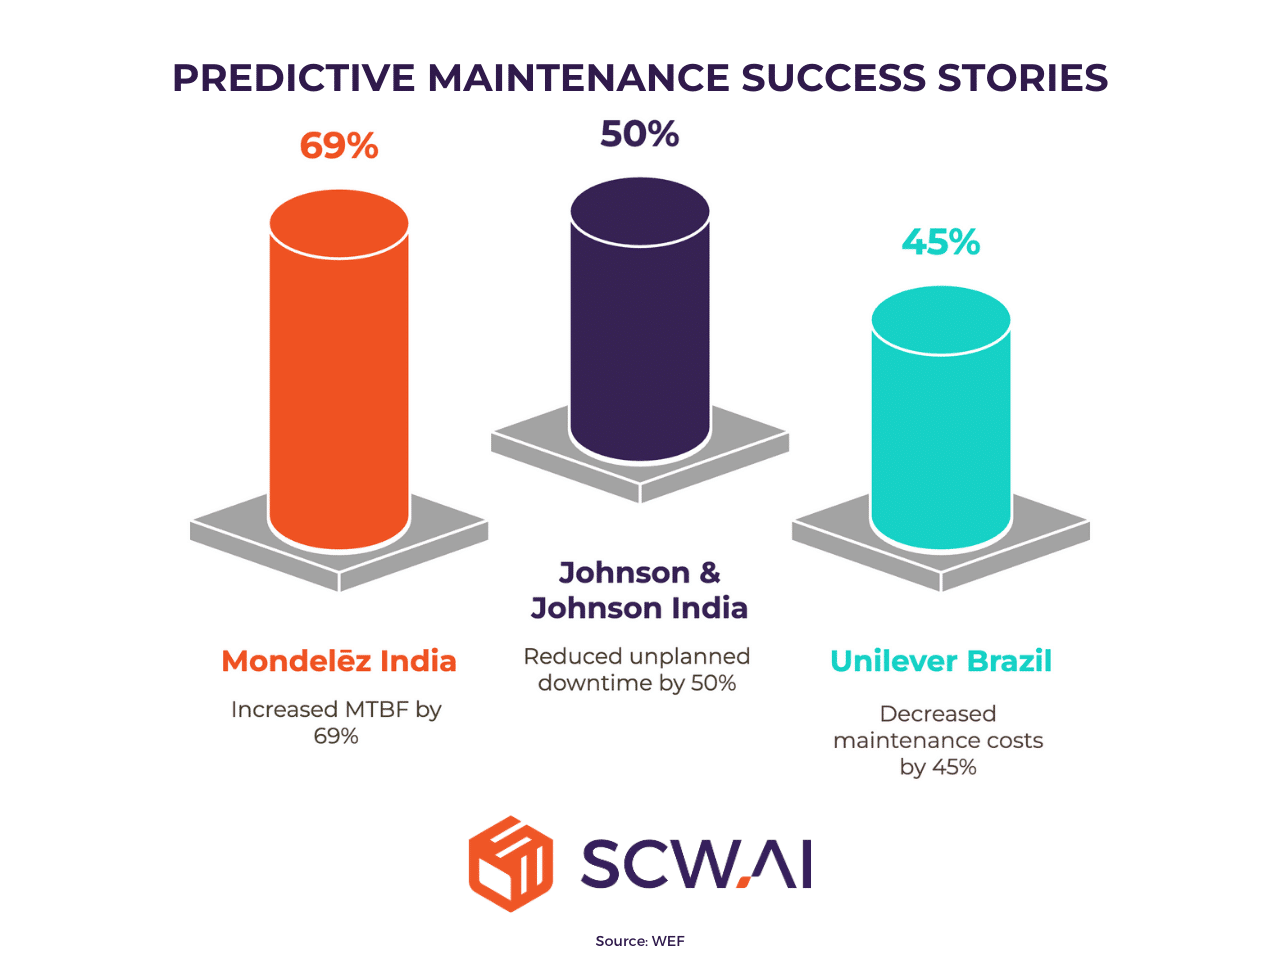
The capabilities of AI and Digital Twins offer significant potential to reduce task completion times while simultaneously improving output quality. In the realm of predictive maintenance, for example, AI algorithms can halve the time required for preparing proactive maintenance schedules while also contributing to reduced maintenance costs and minimizing unplanned downtime.
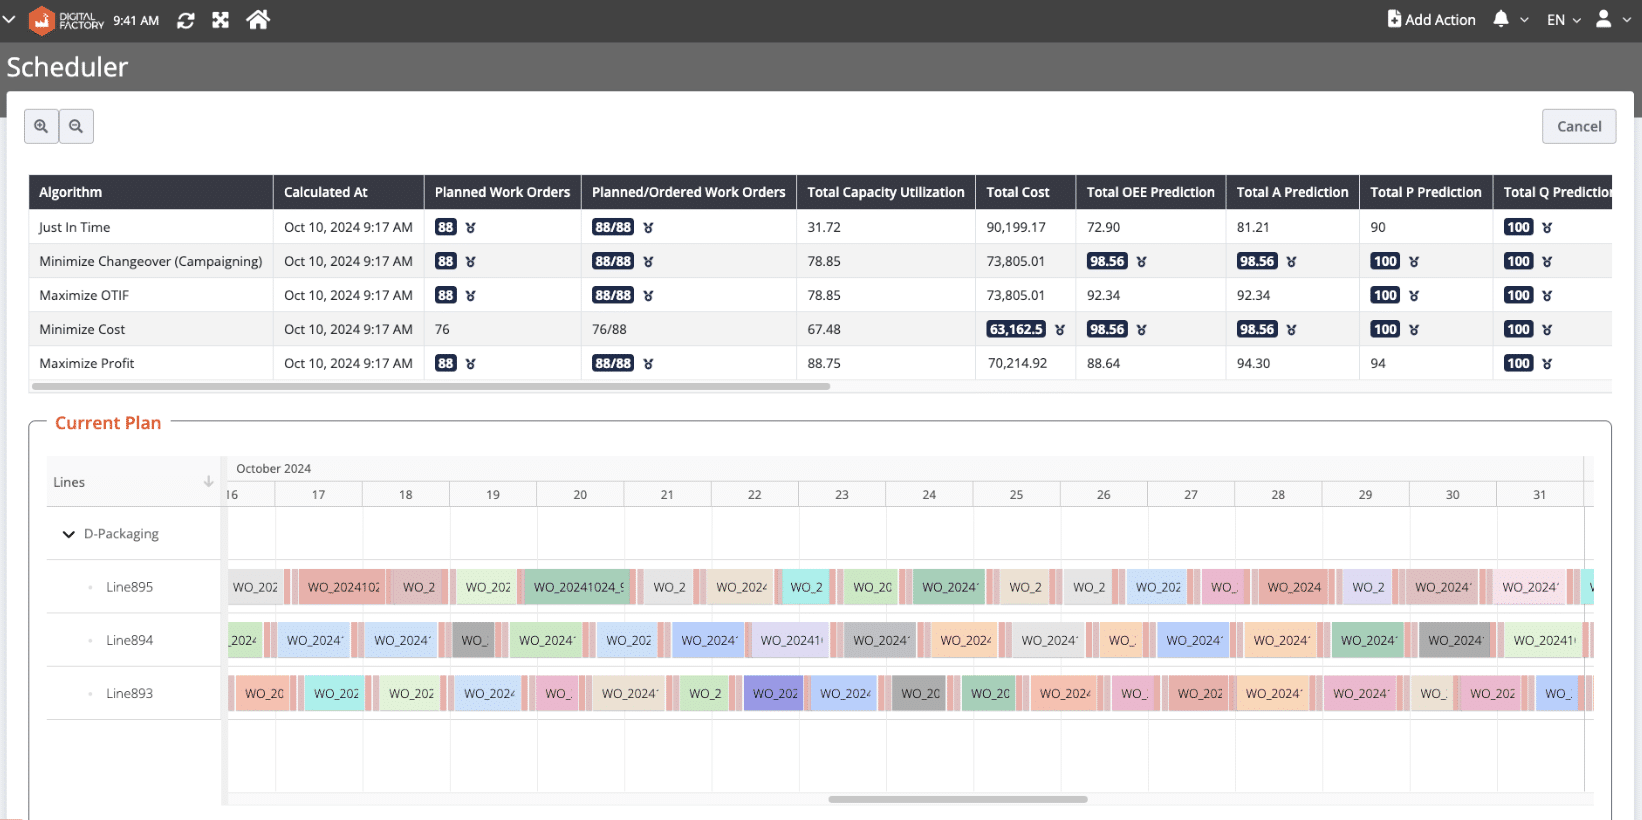
A report by the Boston Consulting Group highlights the transformative impact of AI on production scheduling, noting a 50% reduction in preparation time. Moreover, AI-driven scheduling can demonstrably:
- Minimize changeover durations.
- Maximize OTIF (On-Time In-Full) scores.
- Reduce operational costs.
- Improve Just-In-Time (JIT) delivery performance compared to purely human-driven scheduling.
6. Investing in ESG to Enhance Workforce Engagement
Labor productivity is also tied to employee morale. According to EY, ESG investments can lead to:
- Improved well-being and job satisfaction
- Lower turnover rates
- Stronger team cohesion and engagement
A workforce that feels valued performs better—making ESG not just a compliance issue, but a strategic advantage.
Achieve Maximum Manufacturing Labor Productivity with SCW.AI
Our end-to-end digitalization solution for manufacturers, the Digital Factory Platform, is designed to:
- Make the shop floor visible, including labor performance
- Enable effective task execution
- Support paperless quality operations
- Optimize and simplify scheduling
- Drive sustainability initiatives
Together, these capabilities provide a complete solution for improving labor productivity in manufacturing.
For more information about the Digital Factory Platform—and specifically the Labor Tracker module—feel free to contact us.
To experience its full capabilities, schedule a demo session with us today.