Many manufacturing firms across different industries face fierce competition, which reduces profitability, raises quality expectations, and enhances the bargaining power of customers. In such an environment, monitoring various manufacturing KPIs in automated dashboards is a top priority, as they provide crucial information on business opportunities and challenges and promote data-driven decision-making.
However, due to the abundance of available KPIs, manufacturers often struggle to determine which ones they should monitor. Different times and sectors might require keeping an eye on different KPIs. This article aims to help manufacturing executives identify the most crucial KPIs for their businesses By reading this article, you can discover over 60 of the most crucial manufacturing KPIs. These KPIs are defined based on SCW.AI’s decade of experience working with manufacturers.
To ensure ease of reading, we divide the article into sections for production KPIs, scheduling and planning KPIs, environmental KPIs, and more. At the end of the article, we illustrate how we can assist manufacturers in monitoring many KPIs in real-time and at a granular level with automated dashboards and reports. Additionally, you can download a PDF version of our comprehensive Manufacturing KPIs Handbook for Managers and Executives, where we provide formulas for each KPI. The handbook also includes a self-assessment scoreboard that can be immediately utilized in your factory.
Production KPIs in Manufacturing
Let us start with production KPIs that guide manufacturers to assist greater efficiency.
1. OEE (Overall Equipment Effectiveness)
OEE is calculated by multiplying the percentage of available time of production lines, the performance of production, and the percentage of high-quality end products. The highest achievable OEE score is 100, indicating no loss in production. Manufacturers utilize OEE to pinpoint areas for improvement in equipment and labor efficiency.
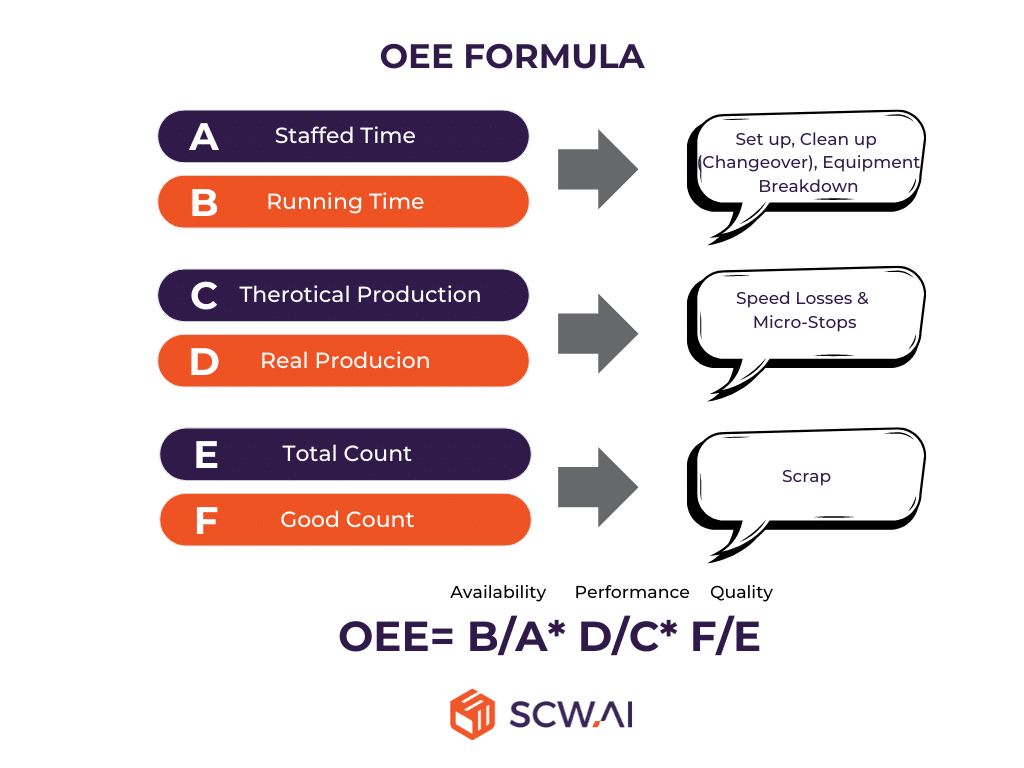
While achieving a 100 OEE score is unrealistic, a World Class OEE is generally accepted to be 80, although this figure may vary for certain industries, such as pharmaceuticals, due to strict regulations. Our analysis revealed that for the pharmaceutical industry, for instance, World Class OEE is approximately 70.
2. TEEP (Total Effective Equipment Performance)
TEEP expands on OEE by incorporating all losses, including idle time, into the calculation. Similar to OEE, 100 indicates perfect TEEP.
3. Cycle Time
Cycle time represents the total time required to complete a production process from start to finish. A shorter cycle time indicates faster production and increased throughput. Manufacturers strive to minimize cycle time to meet customer demand promptly and optimize resource utilization.
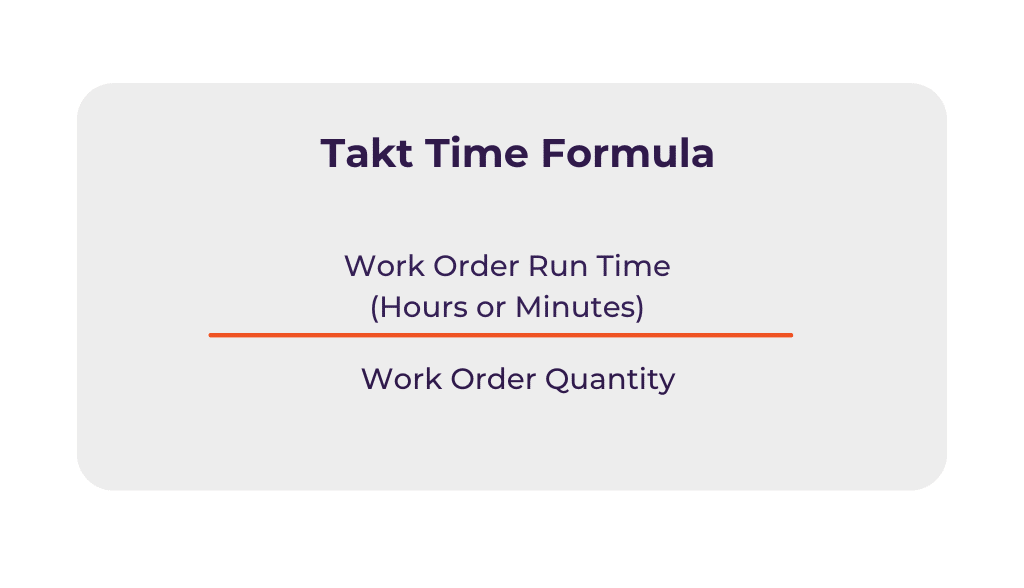
4. Takt time
Takt time sets the pace of production to match customer demand, calculated as Available Production Time (work order run time) divided by Customer Demand or quantity of work order. Manufacturers aim for a takt time that aligns with customer requirements to optimize production scheduling and ensure line balancing.
5. Lead Time
Lead time refers to the time it takes to fulfill a customer order, from order placement to delivery. Shorter lead times result in faster order fulfillment and improved customer satisfaction.
6. Throughput Rate
Throughput rate measures the rate at which a system or process can produce output. A higher throughput rate with same inputs indicates greater production efficiency and capacity utilization. Manufacturers monitor throughput rate to maximize output and minimize idle time.
7. Material Usage Variance
Material usage variance represents the difference between actual and standard quantities of materials used in production. A lower variance indicates closer adherence to planned material usage and better cost control. Manufacturers analyze material usage variance to minimize wastage.
8. Planned maintenance percentage (PMP)
PMP is the percentage of maintenance activities that are planned in advance. A higher PMP signifies proactive maintenance planning and reduced unplanned downtime. For manufacturers that utilize machine learning models for predictive maintenance PMP tends to be higher.
9. Mean Time Between Failure (MTBF)
MTBF measures the average time between equipment failures. A longer MTBF suggests greater machine reliability and longer intervals between equipment malfunctions. Manufacturers use MTBF to schedule preventive maintenance or train predictive maintenance models to minimize production disruptions.
10. Mean Time to Repair (MTTR)
MTTR represents the average time it takes to repair equipment after a failure. A lower MTTR indicates faster repair times and shorter equipment downtimes. MTTR is another metric that can be utilized for training of predictive maintenance models.
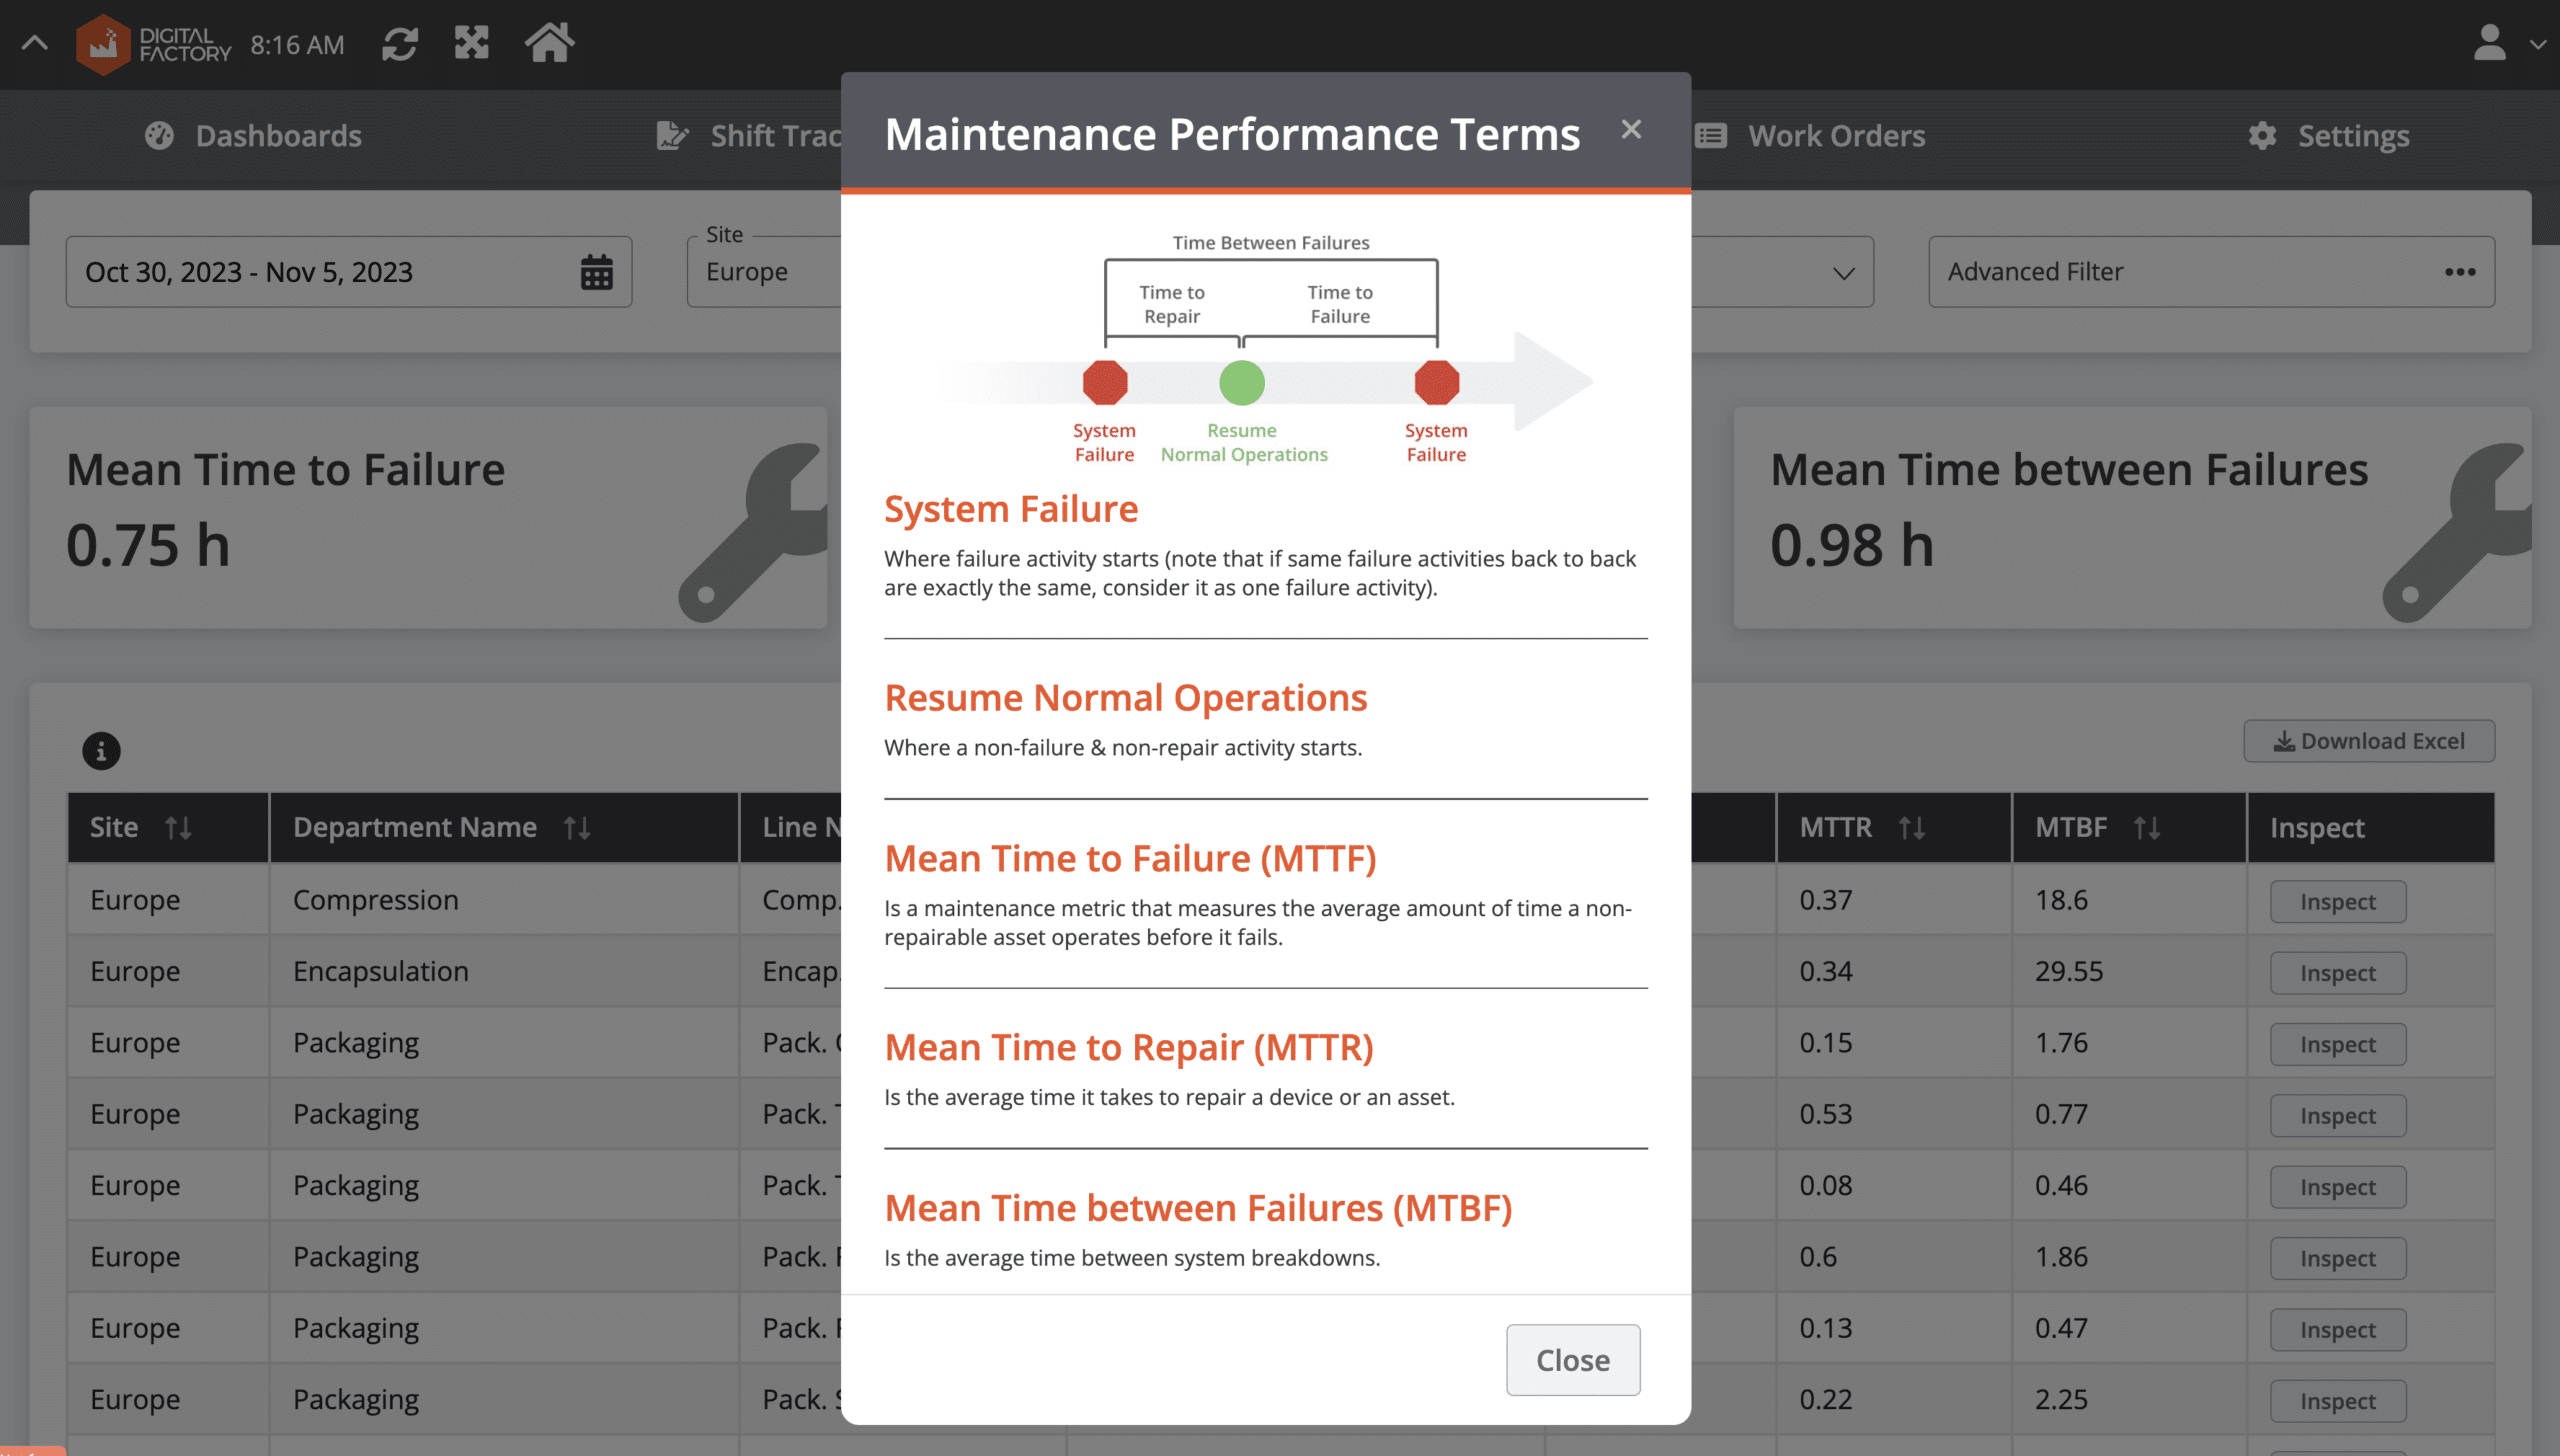
11. Mean Time to Failure (MTTF)
MTTF measures the average duration an equipment fails to work during regular operation, calculated in hours. A higher MTTF indicates better reliability and fewer disruptions, guiding maintenance schedules and equipment decisions for optimal efficiency.
Below image from SCW.AI Maintenance Performance Report demonstrates definition of MTBF, MTTR and MTTF.
12. Changeover time
Changeover time refers to the duration needed to transition from producing one product to another. A shorter changeover time facilitates more frequent production runs and enhances flexibility in meeting customer demands. Minimizing changeover time poses particular challenges and is crucial for heavily regulated industries like pharmaceuticals, where longer clean-up times can significantly impede production.
13. Micro Stop
Micro stops are brief, unplanned interruptions in production that last for a very short duration. While a single micro stop may result in only a small loss, their cumulative impact can significantly disrupt production flow. Manufacturers are advised to monitor micro stops closely to mitigate their effects on productivity.
14. Speed Loss
Speed loss refers to the percentage reduction in operating speed of equipment compared to its maximum capacity. Minimizing speed loss ensures efficient equipment performance and maximum throughput.
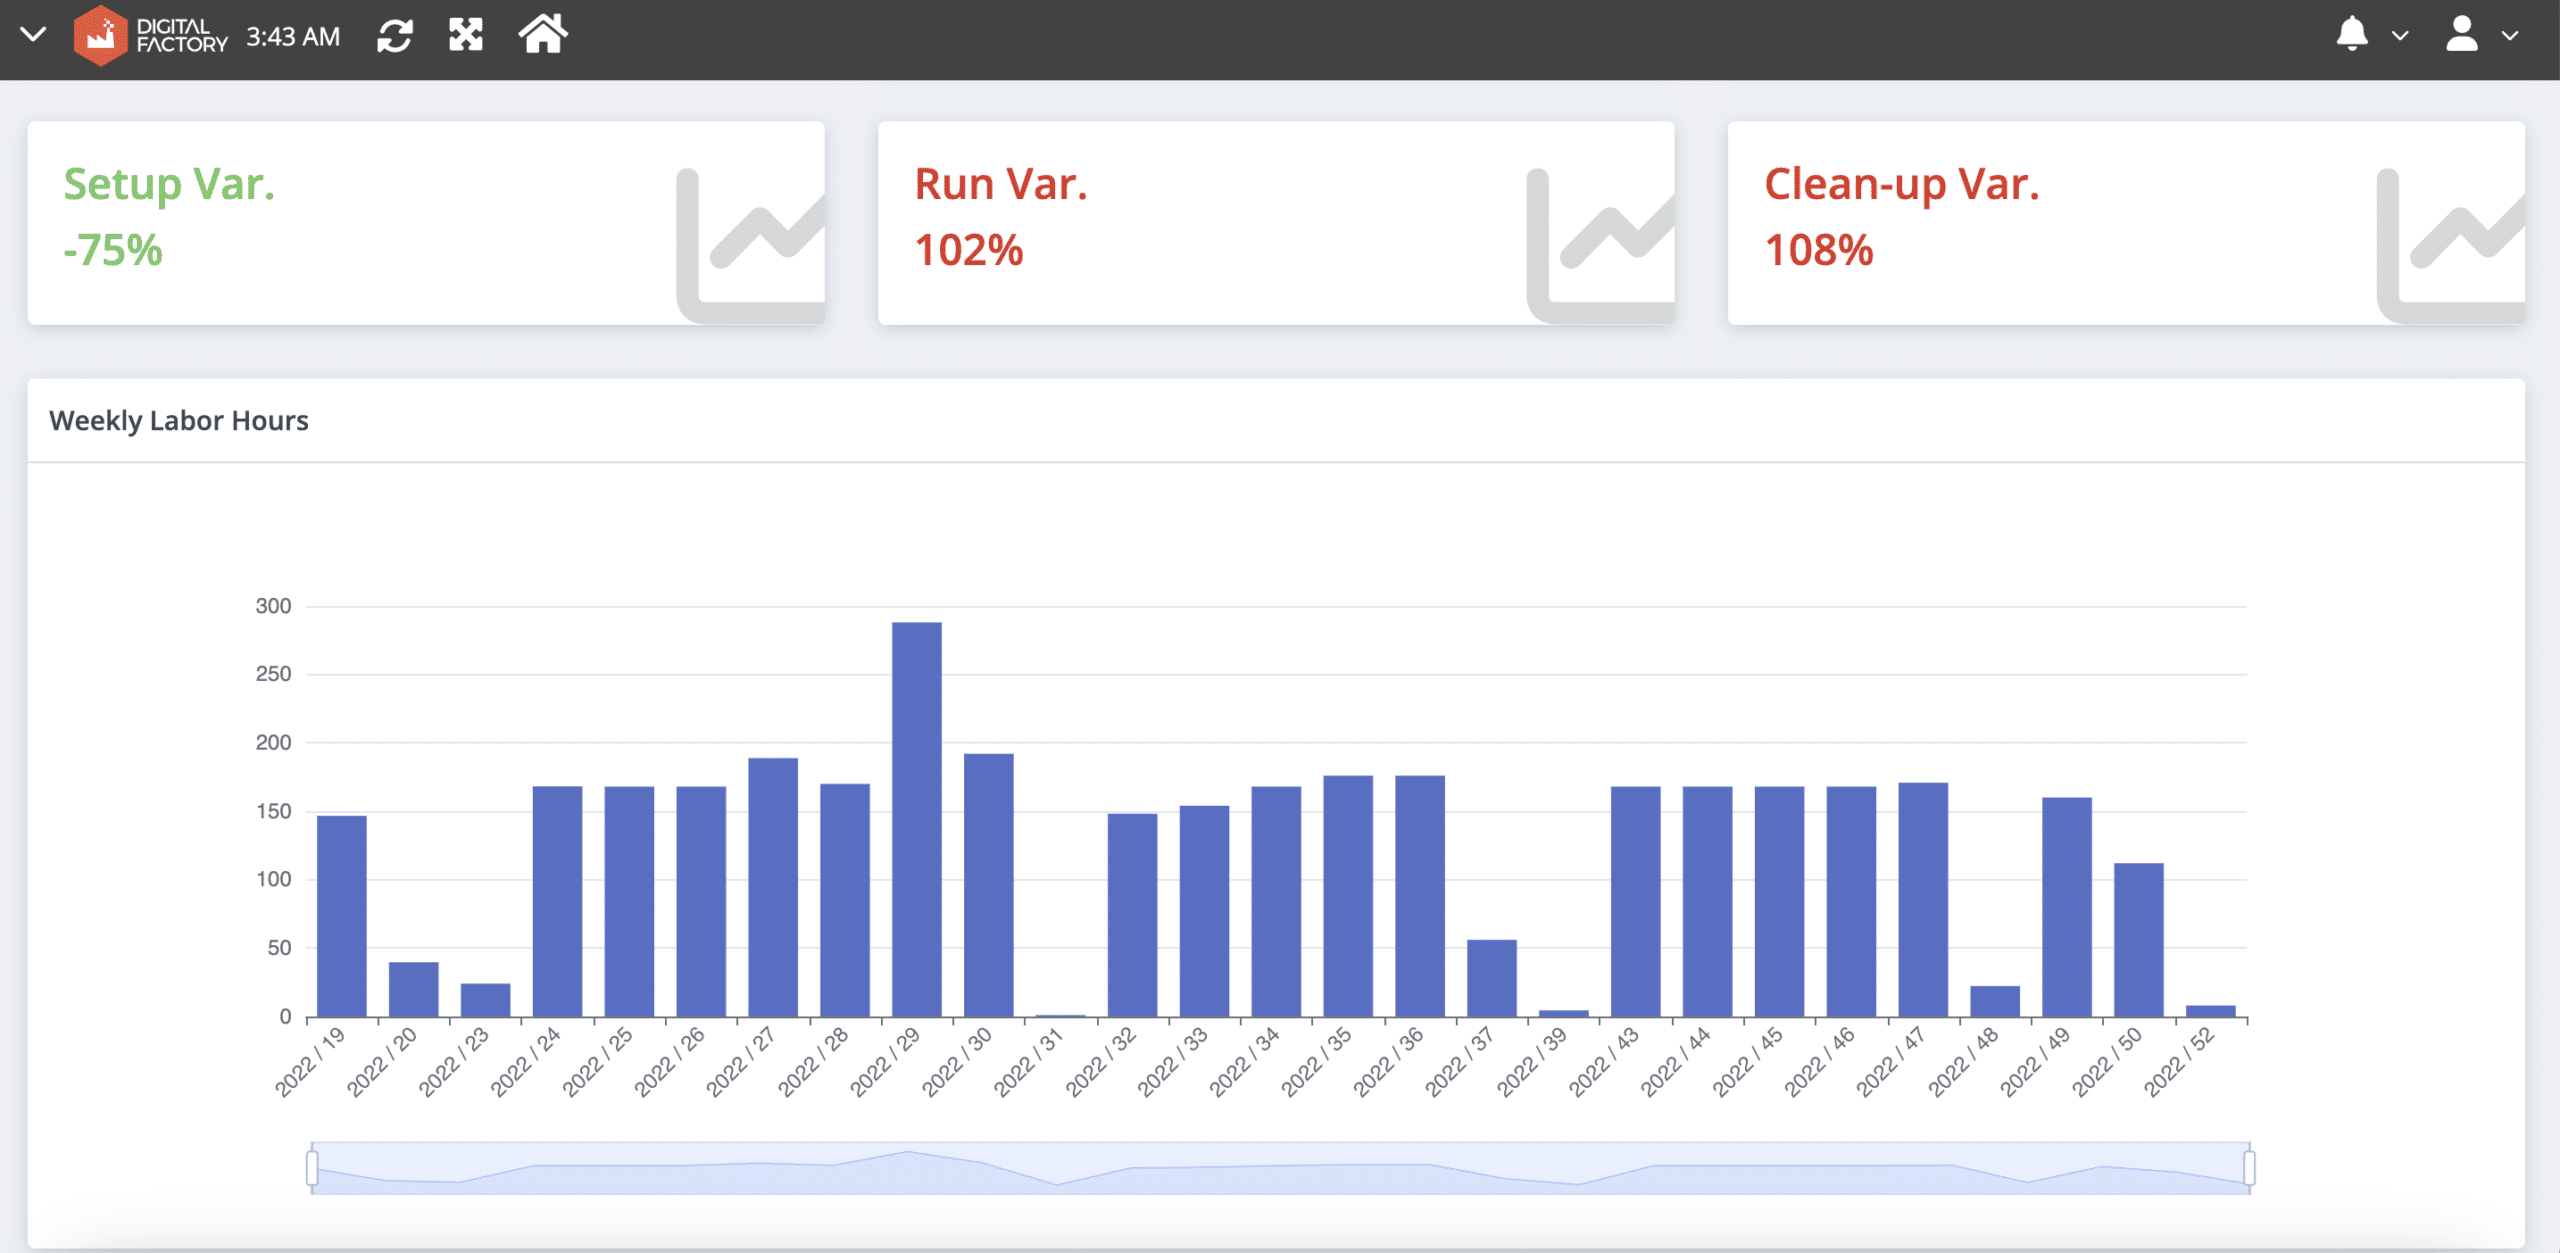
15. Set up Variance
Set up variance represents the difference between planned and actual setup times. A lower variance indicates closer adherence to planned setup times and smoother production transitions. Manufacturers strive to minimize setup variance to reduce downtime.
16. Line Cleaning Variance
Line cleaning variance represents the variance between planned and actual time spent on cleaning production lines. Minimizing line cleaning variance prevents production delays by reducing changeover time.
For instance, SCW.AI’s Labor Performance Report is able to demonstrate line cleaning and set up variance for each worker. Thus, it assists manufacturers to discover bottlenecks.
Scheduling and Planning KPIs
By monitoring below KPIs, manufacturers can optimize production schedules, improve resource utilization, and enhance overall operational efficiency.
17. Production Capacity Rate
The production capacity rate reflects the maximum output a manufacturing system can achieve over a given period. A higher capacity rate signifies optimal utilization of resources. Manufacturers aim to maximize the production capacity rate to meet demand and improve overall operational performance.
18. Capacity Utilization
Capacity utilization is calculated as the ratio of actual production output to maximum potential output, multiplied by 100. A higher utilization rate indicates efficient use of available resources and optimal production efficiency.
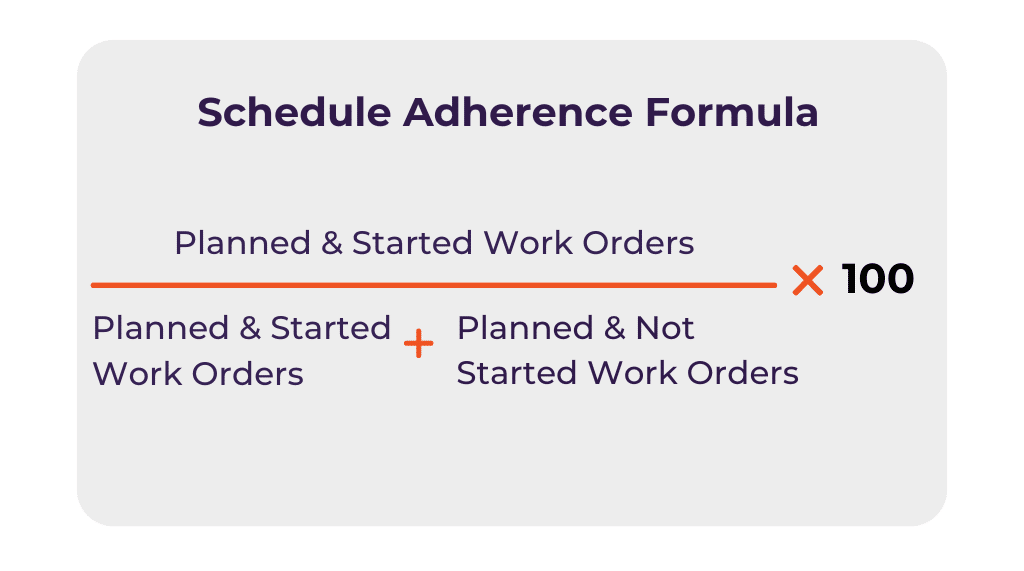
19. Schedule Adherence
Schedule adherence measures the extent to which production activities follow the planned schedule, expressed as a percentage. Higher schedule adherence indicates better alignment of production activities with the planned schedule.
20. Schedule Attainment
Schedule attainment is calculated as the ratio of actual production output to planned production output, multiplied by 100. Higher attainment scores indicates higher production capability of the manufacturers.
21. Schedule Compliance
Schedule compliance measures the percentage of completed production tasks compared to the total planned production tasks. Higher compliance indicates adherence to the planned production schedule without deviations.
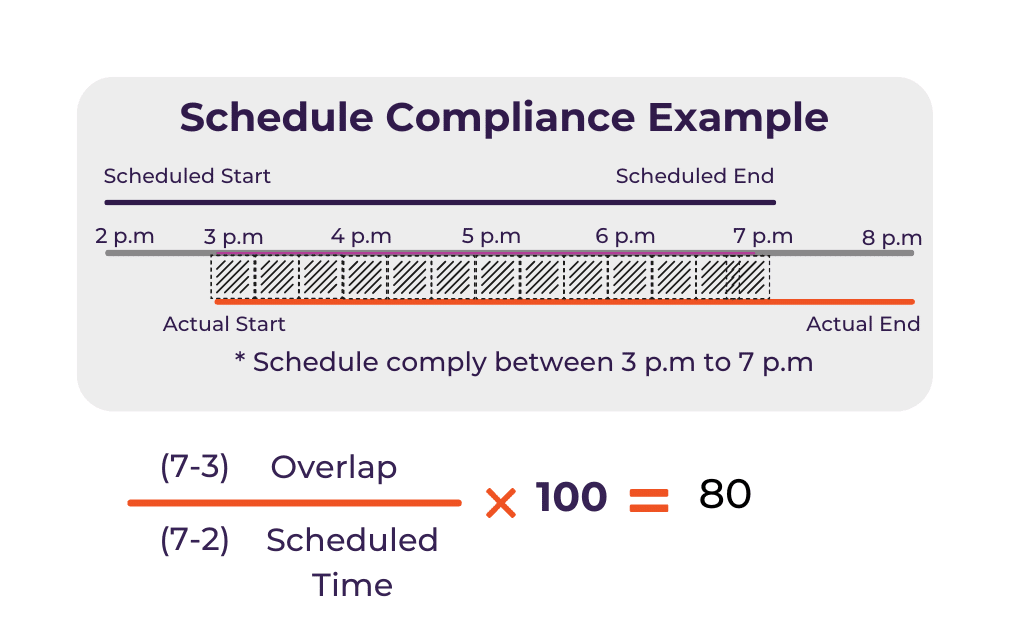
To find out more on schedule adherence, schedule compliance and schedule attainment and their differences you can read our A Complete Guide to Schedule Adherence for Manufacturers article.
22. Demand Forecasting
Demand Forecasting Error measures the variance between forecasted demand and actual demand for products within a specified period. Thus, it quantifies the accuracy of the planning and scheduling activities. Nowadays manufacturers utilize AI driven advanced planning and scheduling tools for improving their demand forecasting accuracy.
To find out more on AI applications for manufacturers read our Top 5 AI Use Cases in Manufacturing article
Quality KPIs in Manufacturing
By monitoring manufacturing KPIs below, managers can identify areas for improvement, implement corrective actions, and ensure consistent delivery of high-quality products to meet customer expectations.
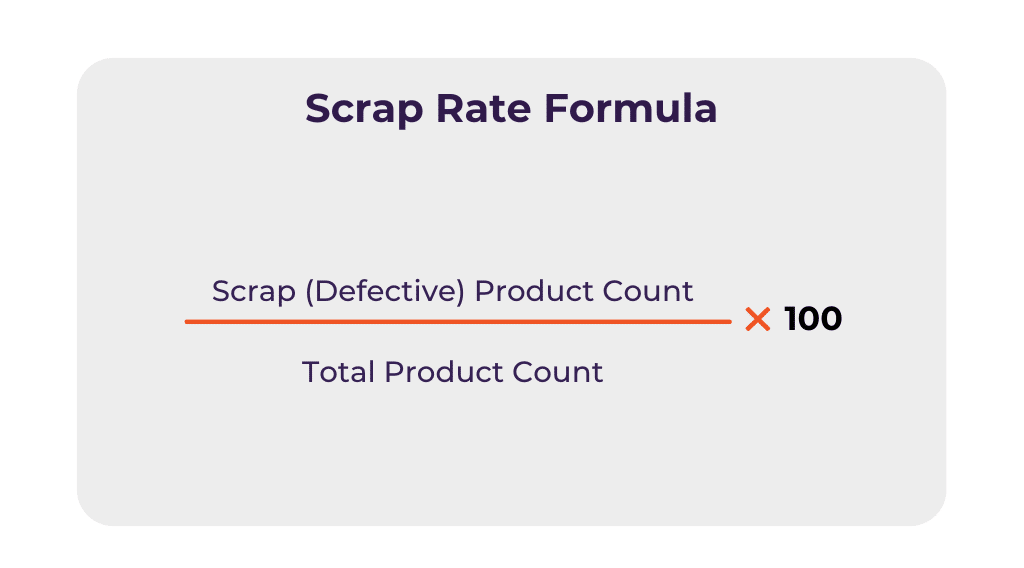
23. Scrap Rate
Scrap rate is calculated as the percentage of defective or unusable products generated during the manufacturing process. A lower scrap rate indicates less waste and higher product quality. Manufacturers focus on reducing scrap rate by improving production processes and implementing quality control measures.
24. Right First Time
Right first time or first pass yield measures the percentage of products that meet quality standards upon the first inspection. Higher first-time quality indicates fewer defects and higher customer satisfaction.
25. Rejection Rate
Rejection rate is calculated as the percentage of products rejected during quality inspections. A lower rejection rate signifies better quality control and higher product reliability.
26. Rework Rate
Rework rate measures the percentage of products that require rework to meet quality standards. Lower rework rate indicates higher production efficiency.
27. Customer Complaint Rate
Customer complaint rate is calculated as the number of complaints received from customers regarding product quality or performance, expressed as a percentage of total products sold. Lower complaint rate indicates higher customer satisfaction and product quality.
Supply Chain KPIs for Manufacturing
Below KPIs offer valuable insights into various aspects of supply chain management, including logistics, inventory management, and order fulfillment. By monitoring these KPIs, manufacturers can optimize supply chain processes, improve customer satisfaction, and enhance overall business performance.
28. OTIF (On Time In Full)
OTIF is determined by the percentage of orders delivered to customers on time and in full. Achieving a higher OTIF reflects superior order fulfillment performance and customer satisfaction.

29. Days Sales Outstanding (DSO)
DSO represents the average number of days it takes to collect payment from customers. A lower DSO signifies more efficient cash flow management and quicker receipt of revenues. By monitoring DSO, manufacturers can evaluate their credit and collection processes, optimize cash flow, and enhance financial stability.
30. Return Reason
Return reason provides insights into the reasons cited by customers for returning products, offering valuable feedback on product quality, functionality, or customer preferences. Manufacturers analyze return reasons to identify trends, address recurring issues, and continuously improve product offerings to meet customer needs effectively.
31. Pick and Pack Cycle Time
Metric Measures the time taken to pick and pack products for shipment. A shorter pick and pack cycle time indicates faster order processing and reduced lead time.
32. Use of Packaging Material
Use of packaging material evaluates the amount of packaging material used per unit of product, aiming to minimize waste and environmental impact while ensuring adequate product protection.
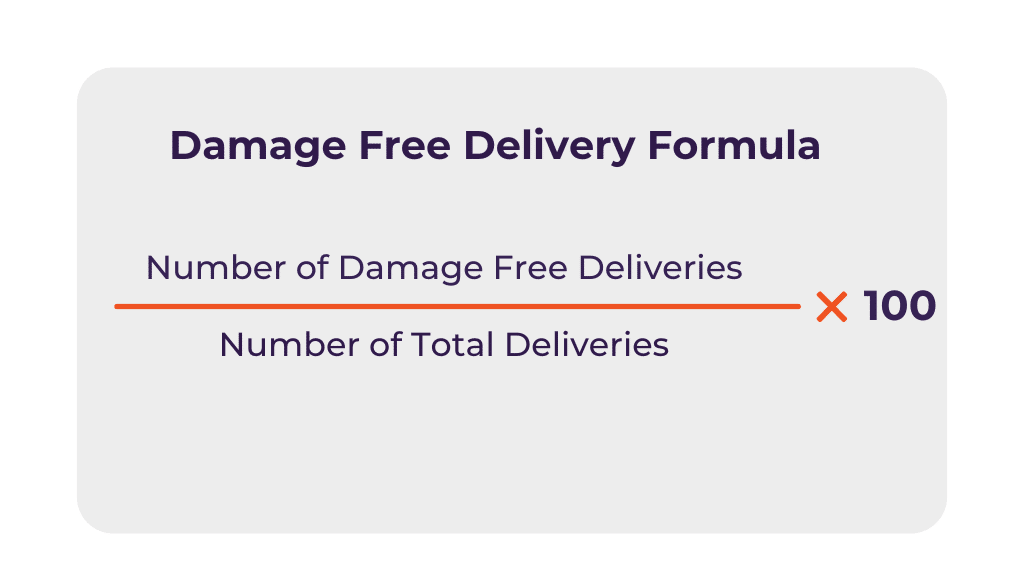
33. Damage Free Delivery
Damage-free delivery measures the percentage of products delivered to customers without any damage, reflecting effective handling, packaging and transportation practices. Manufacturers prioritize damage-free delivery to minimize product returns, warranty claims, and customer dissatisfaction.
34. Customer Satisfaction Index
By tracking customer satisfaction index scores, manufacturers can assess their performance, identify areas for improvement, and prioritize initiatives to enhance the customer experience and drive repeat business.
35. Freight Cost
Freight cost evaluates the total cost incurred for shipping products to customers, impacting overall product profitability and supply chain efficiency. By monitoring freight costs, manufacturers can identify opportunities to optimize transportation routes, consolidate shipments, negotiate favorable freight rates, and minimize transportation expenses.
Inventory KPIs for Manufacturing
Inventory KPIs below can be considered as a subcategory of supply chain KPIs for manufacturers.
36. Inventory Turnover
Inventory turnover measures how quickly inventory is sold and replenished, indicating inventory management efficiency. A higher inventory turnover ratio suggests more effective inventory management practices and better utilization of working capital. Manufacturers monitor inventory turnover to optimize stock levels, minimize carrying costs, and improve cash flow.
37. Inventory to Sales Ratio
Metric compares inventory levels to sales volume, providing insights into inventory management effectiveness. A lower ratio indicates efficient inventory turnover and optimal stock levels aligned with customer demand. Manufacturers strive to maintain a balanced inventory to sales ratio to avoid overstocking or stockouts.
38. Inventory Velocity
Inventory velocity evaluates the speed at which inventory moves through the supply chain, minimizing obsolescence and carrying costs. A higher inventory velocity indicates faster inventory turnover and more efficient supply chain operations.
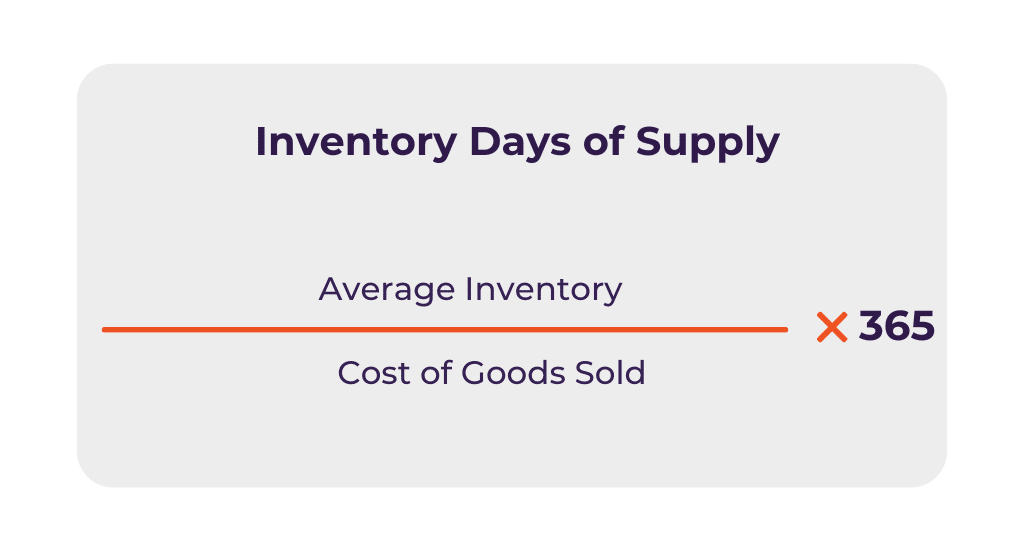
39. Inventory Days of Supply
Inventory days of supply calculates the number of days inventory can sustain operations, informing production and procurement strategies. A lower inventory days of supply indicates leaner inventory levels and better inventory management efficiency. Manufacturers aim to minimize inventory days of supply to reduce carrying costs, improve cash flow, and enhance responsiveness to market demand fluctuations.
40. Inventory Holding Cost
Inventory holding cost calculates the expenses associated with storing inventory, guiding cost-effective inventory management practices. It encompasses expenses like storage fees, insurance premiums, obsolescence charges, and depreciation costs. By minimizing inventory holding costs, manufacturers improve profitability.
41. Stockouts
Stockouts measure the frequency and duration of inventory shortages, highlighting potential disruptions in supply chain operations. A lower stockout rate indicates better inventory management and higher customer satisfaction levels.
42. JIT Delivery (Just-in-Time Delivery)
JIT delivery ensures timely delivery of materials and components to support JIT production schedules, minimizing inventory holding costs and improving operational efficiency. By aligning material deliveries with production demand, manufacturers reduce inventory levels, lead times, and storage costs while enhancing production flexibility and responsiveness to customer orders.
Safety KPIs in Manufacturing
Ensuring a safe working environment is paramount in manufacturing facilities to protect employees and maintain operational continuity. The following Safety KPIs are crucial for monitoring and improving safety standards.
43. Days without Safety Incident
Days without Safety Incident measures the consecutive number of days during which no workplace accidents or incidents resulting in injury or harm occur. Increasing the number of days without safety incidents indicates a safer work environment. Implementing regular safety training to employees, conducting routine safety inspections, and fostering a culture of safety awareness can help extend the duration of days without safety incidents.
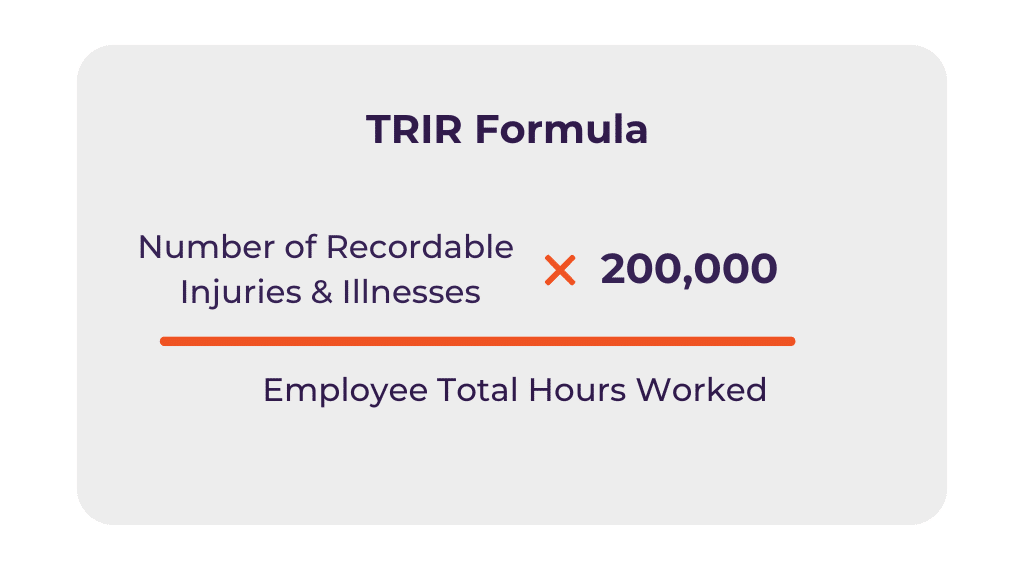
44. TRIR (Total Recordable Incident Rate)
TRIR calculates the total number of recordable workplace incidents per 100 full-time employees within a given period, typically one year. Decreasing TRIR is desirable, indicating fewer workplace incidents and a safer working environment for employees.
45. LTIFR (Lost Time Injury Frequency Rate)
LTIFR measures the rate of lost time injuries per million hours worked, providing insight into the frequency of injuries that result in lost workdays. Lower the LTIFR indicates fewer injuries on the shop floor.
46. Number of Safety Violations
Metric quantifies the total instances of non-compliance with safety regulations or protocols within a specified timeframe. Conducting regular safety audits, providing ongoing safety training, implementing disciplinary measures for safety violations, and promoting a culture of accountability for safety can help minimize the number of violations.
47. Employee Attendance Rate
Employee Attendance Rate measures the percentage of scheduled work hours fulfilled by employees without absences. To measure this metric in real-time with ease and evacuate employees when an undesired event like a fire occurs, RTLS systems and IoT devices can be handy. As demonstrated in the image below, such tools allow managers to know in which lines specific employees are checked in.

48. Satisfaction with Working Environment Score
Satisfaction with Working Environment Score assesses employees’ perceptions of safety and satisfaction with their workplace environment through surveys or feedback mechanisms. Improving the satisfaction with working environment score is desirable, indicating higher levels of employee morale, engagement, and perceived safety.
49. Percentage of Workers Trained for Health & Safety
KPI measures the proportion of employees who have received training on health and safety procedures and protocols. Increasing the percentage of workers trained for health & safety is beneficial, ensuring that all employees are equipped with the knowledge and skills to mitigate workplace hazards and respond effectively to emergencies.
50. Mean Time to Resolution of Safety Issues
Mean Time to Resolution of Safety Issues calculates the average duration taken to address and resolve safety-related concerns or incidents from the time they are reported. Establishing clear reporting channels for safety issues, implementing efficient incident response protocols, conducting root cause analyses to identify underlying safety issues, and prioritizing corrective actions based on risk severity can help manufacturers to minimize resolution duration. To do so executives should improve factory visibility and issue tracking via digital factory solutions.
Environmental KPIs for Manufacturing
Following environmental KPIs enable manufacturers to monitor their environmental performance, track progress towards sustainability goals, and implement strategies to minimize environmental impact throughout the manufacturing lifecycle.
51. GHG Emissions
GHG emissions measure the amount of greenhouse gasses emitted during manufacturing processes. Lower GHG emissions signify reduced environmental impact and commitment to sustainability. Manufacturers monitor GHG emissions to comply with regulations, mitigate climate change risks, and enhance corporate social responsibility.
52. Product Carbon Footprint
Product carbon footprint quantifies the greenhouse gas emissions associated with a product’s lifecycle. By assessing the carbon footprint of products, manufacturers can redesign their products in a more ecological way and can reduce per product emissions.
53. Energy Consumption
Energy consumption measures the amount of energy used in manufacturing operations. Reduced energy consumption indicates greater energy efficiency and lower operating costs. Manufacturers implement initiatives, such as upgrading equipment, optimizing processes, and adopting renewable energy sources, to minimize energy consumption and environmental impact.
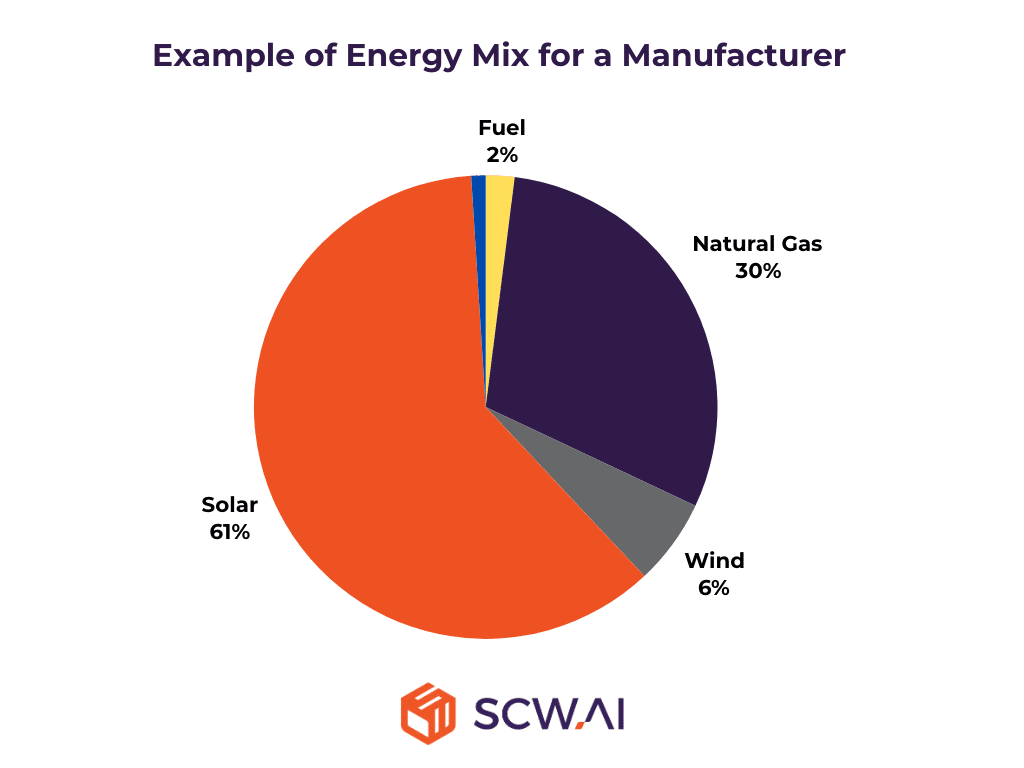
54. Energy Mix
Energy mix evaluates the sources of energy used in manufacturing processes, such as fossil fuels, renewable energy, or grid electricity. By diversifying the energy mix and increasing reliance on renewable sources, manufacturers reduce carbon emissions and dependency on non-renewable resources.
55. Percentage of Non-Virgin Material Used
Percentage of non-virgin material used assesses the incorporation of recycled or reclaimed materials in manufacturing processes. Higher usage of non-virgin materials indicates commitment to resource conservation, waste reduction, and circular economy principles.
56. Percentage of Recyclability of Product
Percentage of product recyclability evaluates the ease of recycling and reuse of manufactured products. Products with higher recyclability are environmentally friendly and contribute to a circular economy by reducing waste and conserving resources.
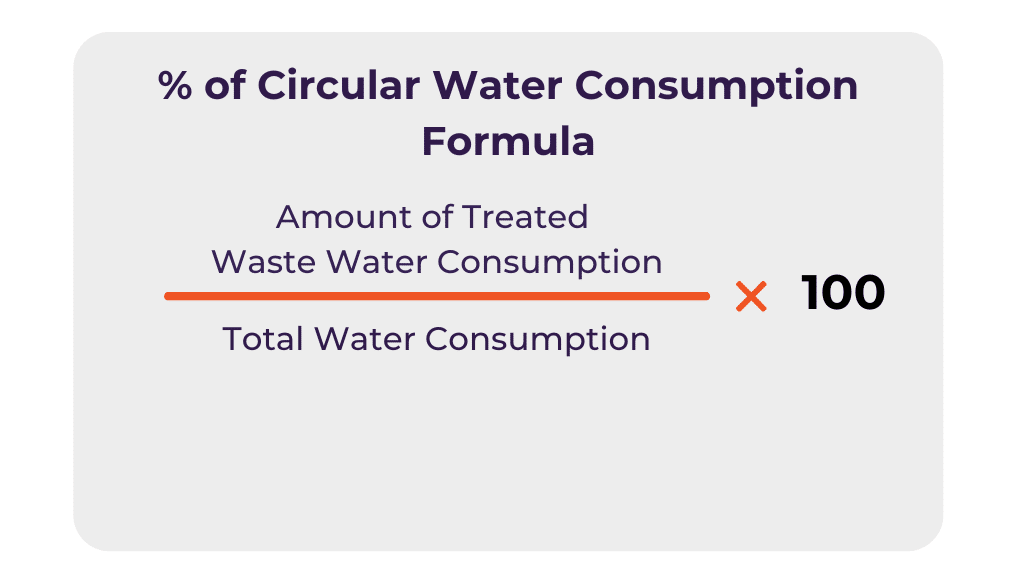
57. Percentage of Circular Water Consumption
Metric measures the proportion of water recycled or reused in manufacturing processes. By increasing circular water consumption, manufacturers conserve freshwater resources.
58. Percentage of Circular Water Discharge
Percentage of circular water discharge evaluates the proportion of wastewater treated and reused in manufacturing processes. Manufacturers invest in wastewater treatment technologies and sustainable practices to minimize water discharge.
59. Waste Reduction Rate
Waste reduction rate measures the percentage of waste generated relative to production output. Higher waste reduction rate indicates effective waste management practices, such as recycling, reuse, and waste minimization.
Financial KPIs for Manufacturing
The KPIs below offer valuable insights into cost management, revenue generation, and return on investment, empowering manufacturers to make informed decisions and achieve financial success.
60. Unit Maintenance Cost
Unit maintenance cost evaluates the expenses incurred for maintaining equipment or machinery per unit of production output. Lower unit maintenance cost indicates efficient maintenance practices and optimal asset utilization.
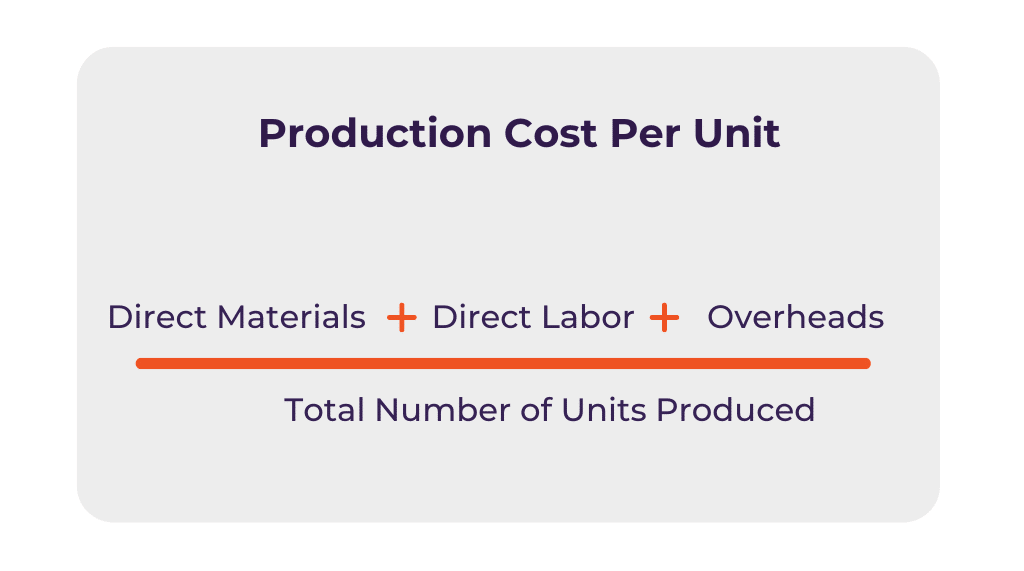
61. Production Cost Per Unit
Production cost per unit calculates the total cost of manufacturing per unit of product. Lower KPI signifies greater cost efficiency and profitability. Manufacturers optimize production processes, streamline operations, and negotiate favorable supplier contracts to reduce production cost per unit and maintain competitiveness in the market.
62. Avoided Cost
Avoided cost assesses the cost savings achieved through efficiency improvements or waste reduction initiatives. By identifying and quantifying avoided costs, manufacturers measure the financial benefits of industry 4.0 transformation, digital lean initiatives and sustainability practices.
63. Unused Capacity Cost
Unused capacity cost evaluates the expenses incurred for maintaining unused production capacity. By minimizing unused capacity cost, manufacturers reduce overhead expenses.
64. Overtime Hours
Overtime hours measure the additional labor hours worked beyond regular schedules. High overtime hours indicate inefficiencies in job shop scheduling, resource allocation, or work order management.
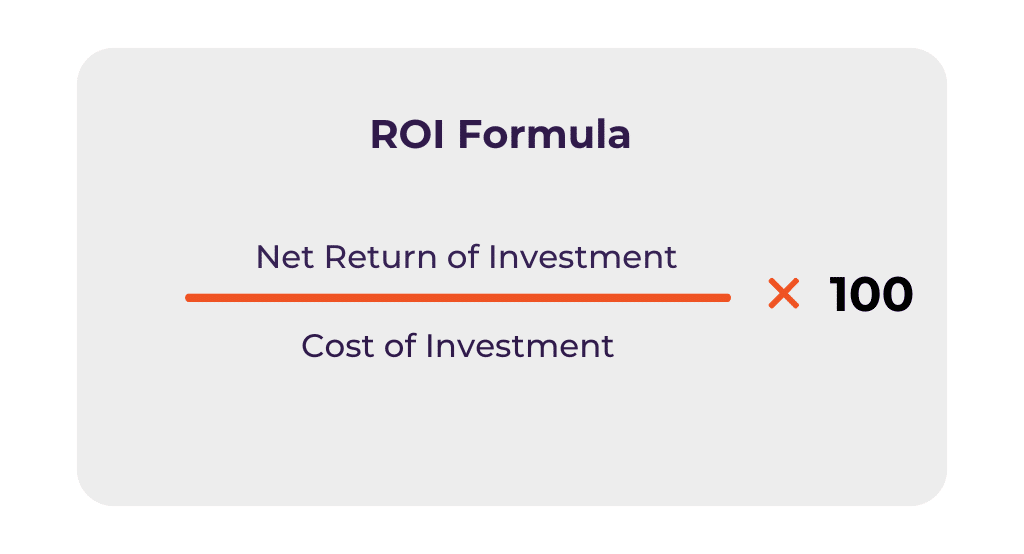
65. ROI (Return on Investment)
ROI calculates the financial return generated from an investment. Higher ROI indicates greater profitability and effectiveness of investment decisions. By utilizing our ROI Calculator, you can estimate the financial return of your digital factory investments.
Utilize Real-Time Manufacturing KPI Dashboards with SCW.AI
For many manufacturers, monitoring manufacturing KPIs is ineffective or even impossible due to the following reasons:
- Data Availability: Data is manually collected, resulting in the inability to calculate metrics or calculate them with significant delays, which hinders effective management in identifying and resolving bottlenecks.
- Automated Data Visualization: Manufacturers interpret factory data on Excel sheets or similar tools that require manual effort, obscuring real-time metrics and making it difficult for management to gain insights.
SCW.AI’s Digital Factory Platform addresses both of these problems. With the use of IoT devices and expertise in Modbus PLC and OPC connections, SCW.AI gathers high-quality real-time factory data in an automated way. This data is then visualized on automated dashboards and reports for the management team through a cloud manufacturing service. As a result, factories can effortlessly assess production KPIs, scheduling KPIs, quality KPIs, supply chain KPIs, and other metrics in real-time.
To discover Digital Factory Platform in action and start monitoring manufacturing KPIs in real time, book a demo with us now.
If you have further questions or feedback regarding our list of manufacturing KPIs you can contact us.
If you interested in our other eBook, you can download Bridging Europe’s Pharma Productivity Gap with Digital Factory Transformation Now!
Get Your Free "Manufacturing KPIs Handbook"
Fill out the form to request your free download.