Production capacity is a crucial concept for manufacturers, as deviations from optimal capacity can lead to increased costs and missed productivity on the shop floor. However, the variety of methods for calculating production capacity often causes confusion. In the first part of this article, we aim to clarify these methods and provide guidance on when to use each.
The second part of the article offers practical strategies for manufacturing leaders to improve capacity. It challenges outdated approaches, which often rely on costly measures like adding shifts, expanding lines, or outsourcing production. Instead, we advocate for digital factory transformation—enhancing capacity through data-driven decisions, intelligent automation, and reducing non-value-added tasks.
What is Production Capacity

Production capacity is defined as the maximum possible output a manufacturer can achieve with its current resources. Understanding this limit is crucial for both short-term and long-term decision-making.
For instance, when a potential customer requests a specific quantity of goods by a certain date, knowing the production capacity and utilization allows the manufacturer to decide whether to accept the contract or negotiate terms.
Similarly, if there is an anticipated long-term surge in customer demand, producers must assess whether their current capacity is sufficient to meet this demand. If not, they may need to invest in capital improvements or digital technologies to enhance production capacity.
For example, in the video below, Michael Altman, VP of End-to-End US Supply Chain Operations at Kenvue, explains how increasing capacity became essential for the pharmaceutical company during the COVID-19 pandemic. Some products experienced a twelvefold surge in demand initially, which later stabilized at three times pre-pandemic levels. Clearly, understanding production capacity is key to making informed business decisions in such situations.
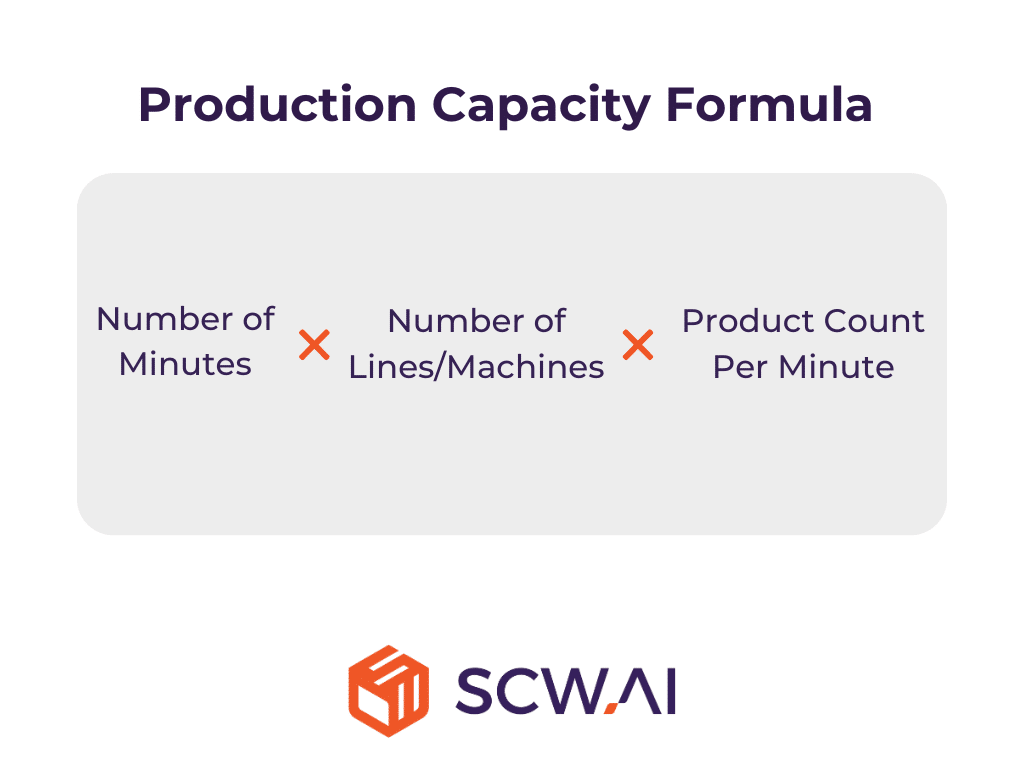
Production Capacity Formula
The formula for calculating production capacity over a specific period is straightforward: Multiply the number of minutes in that period by the number of machines or lines in the factory, and then multiply by the product count per minute. However, while this calculation may seem simple on paper, there are several challenges:
- Multiple Products with Different Speeds: Manufacturers often produce more than one product, each with different production speeds. This variability complicates the capacity calculation.
- Varying Machine/Line Speeds: Different machines or lines may operate at different speeds. For example, granulating 100 units of a drug might take longer than packaging the same quantity. When work orders are interdependent—where jobs follow processes like granulation, compression, encapsulation, and packaging—the overall production speed is determined by the slowest process.
- Low-Volume, High-Mix Industries: In industries characterized by low-volume, high-mix production, where standardization might be limited, capacity calculations may require different formulas to accurately reflect production capabilities.
- Definition of Time Period: Number of minutes used in the capacity formula can vary among manufacturers. Some argue that only working hours should be considered, while others believe that only planned run durations should be included.
Our Handbook on Manufacturing KPIs provides in-depth explanations and formulas for over 60 key performance indicators including production capacity. Download your copy today.
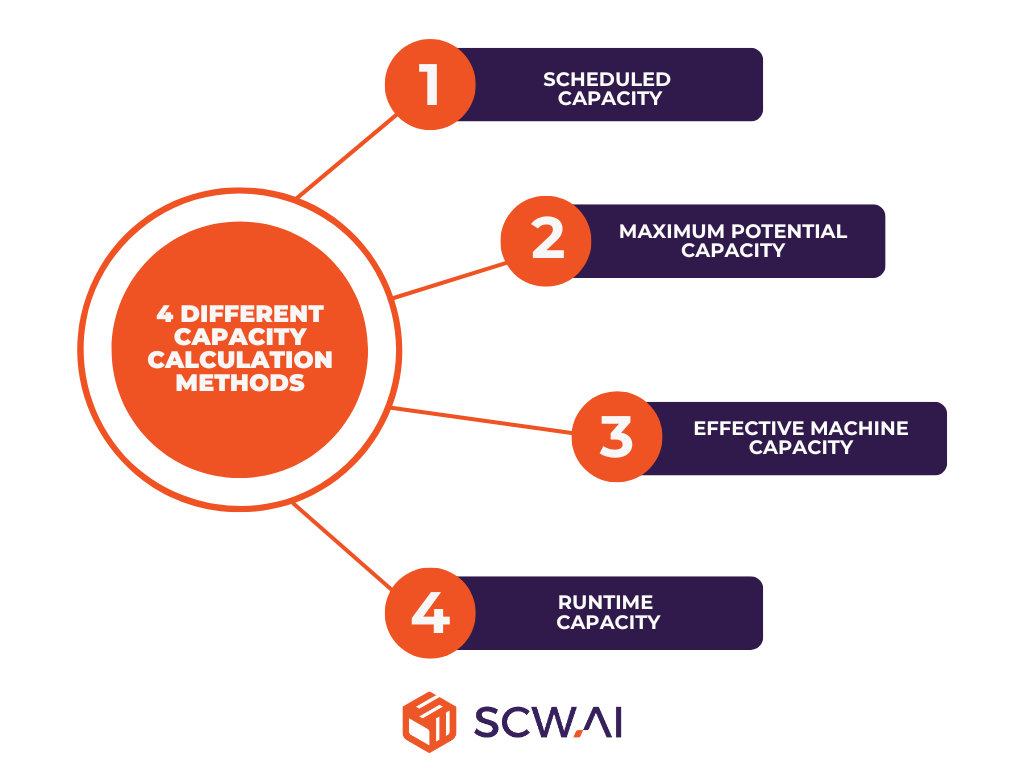
4 Different Capacity Calculation Methods
As previously mentioned, the definition of the time period used in calculating production capacity can vary, and each method can significantly impact the capacity level as well as KPIs like capacity utilization and unused capacity cost. To determine the most suitable approach for your business, it is essential to understand these different methods.
1. Scheduled Capacity
Scheduled capacity is the most common method for calculating production capacity. It measures the total time available for production based on the scheduled working hours of the labor force. For example, if a manufacturer operates with two shifts of 8 hours on weekdays, the daily time value is 16 hours, or 960 minutes, and the weekly time value is 80 hours, or 4,800 minutes.
2. Maximum Potential Capacity
Maximum potential capacity calculates production capacity based on the entire day, or 1,440 minutes, as the total time available. The rationale behind this approach is that fixed costs apply around the clock, so using the full 24 hours provides a more accurate measure of the cost of unused capacity.
While this method offers certain benefits, it also has limitations. If the focus is solely on maximizing potential capacity without adding more lines or machines, improving capacity becomes impossible. For factories that do not operate 24/7, this approach can lead to inertia, making it difficult to pursue continuous improvement projects.
3. Effective Machine Capacity
The effective machine capacity method acknowledges that even with three shifts, machines and production lines cannot run continuously for 24 hours a day without significantly reducing their lifespan and cause a lower first pass yield. Therefore, when calculating production capacity, the duration at which machines are ineffective must be subtracted from the total available time.
To determine ineffective machine hours, manufacturers can refer to the equipment’s operating instructions or consult with the vendor. Alternatively, digital twins or manufacturing generative AI models can be used to find the optimal effective machine time. For example, such an analysis might reveal that equipment operates effectively and sustainably for up to 21 hours, or 1260 minutes, per day. This adjusted figure can then be used in the production capacity calculation.
4. Runtime Capacity
The runtime capacity method recognizes that not all time during a day is productive due to necessary pauses in operations. These include breaks for workers, machine setup for the next batch, line cleanups—especially crucial in cGMP-regulated industries—and other planned downtimes.
In this approach, these planned downtimes and idle periods are subtracted from the scheduled capacity, resulting in the total time available for actual runtime. For example, instead of the full 16 hours, or 960 minutes, available in a factory with two shifts, the effective runtime might be reduced to 11 hours, or 660 minutes, after accounting for these non-productive periods.
The advantage of this method is that it allows manufacturers to focus on maximizing runtime through lean manufacturing practices or factory automation. However, this approach closely aligns with Overall Equipment Effectiveness (OEE). Therefore, if a manufacturer is already monitoring OEE, tracking runtime capacity separately may be unnecessary. Additionally, focusing solely on runtime capacity can lead to misinterpretation of the fixed costs incurred over a full 24-hour period, potentially biasing cost-benefit analyses.
Discover the various OEE calculation methods in our comprehensive guide.
4 Cost Effective Ways of Improving Production Capacity
In this section, we aim to showcase four viable and cost-effective best practices that can help manufacturers boost productivity. We intentionally exclude strategies that, while common, tend to be costly and often less effective, such as:
- Increasing the number of shifts
- Purchasing new equipments or replacing old machines
- Outsourcing production
Instead, our focus is on how manufacturers can reach their optimal production levels through more innovative and sustainable methods. These include enhancing OEE, reducing changeover times with AI Schedulers, and leveraging machine learning for predictive maintenance, among others.

1. Improve Your OEE
Improving OEE directly correlates with increased production levels, as it reflects the minimization of availability, performance, and quality losses. For example, if a manufacturer can produce 200 pieces per hour with an OEE of 50%, increasing the OEE to 75% means the same manufacturer can produce 300 pieces per hour.
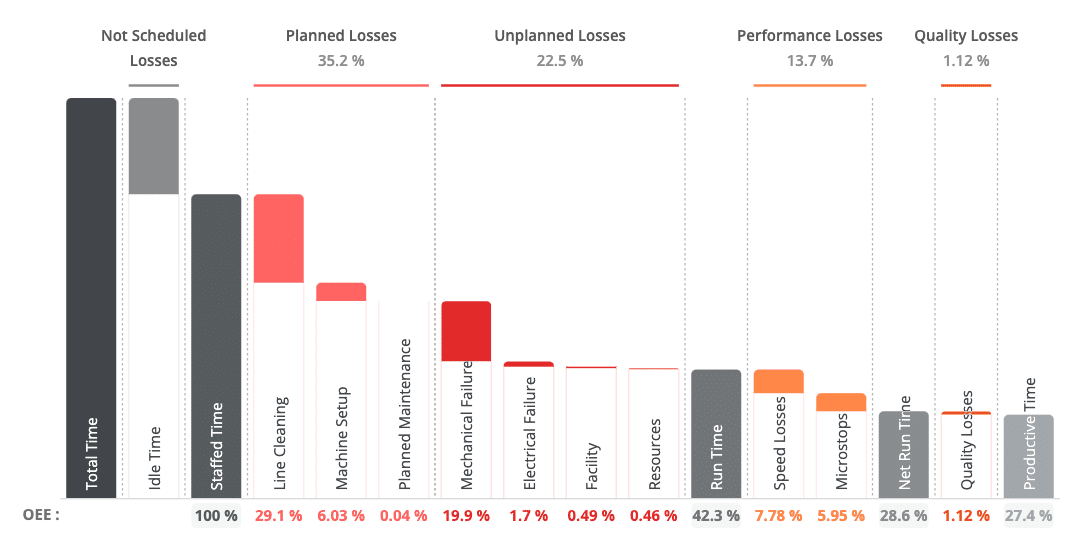
To enhance OEE, manufacturers should begin by monitoring their production with tools like OEE Trackers or OEE Dashboards. These tools offer real-time insights into the OEE of each production line, using visualizations like Waterfall Charts (see image below). They also alert the appropriate personnel when downtime occurs on specific machines, detect anomalies in machine configurations with AI algorithms, and enable preventive actions. This empowers manufacturers to make timely, data-driven decisions to address production bottlenecks.
Additionally, Action Trackers can be an effective solution for improving OEE. They serve as a unified knowledge base for manufacturers, simplifying issue detection with a single button. Managers can convert issues into actions by assigning personnel to resolve bottlenecks, complete with task descriptions. Furthermore, AI algorithms within the Action Tracker can identify patterns between specific issues and actions, automating the task assignment process. Overall, shop floor management and accountability are enhanced, leading to faster issue resolution and improved OEE.
For instance, according to our OEE benchmarking analysis for the pharmaceutical industry, the average OEE for pharmaceutical manufacturers is around 37. In contrast, fully digitized Pharma 4.0 companies achieve an OEE of 70. To harness the potential of digital factory solutions with such significant impact, you can start by exploring our OEE and Action Trackers.
2. Minimize Production Period with AI Scheduler
Advanced planning and scheduling systems can significantly improve runtime capacity by reducing unproductive times, such as changeover durations. There are two key reasons for this:
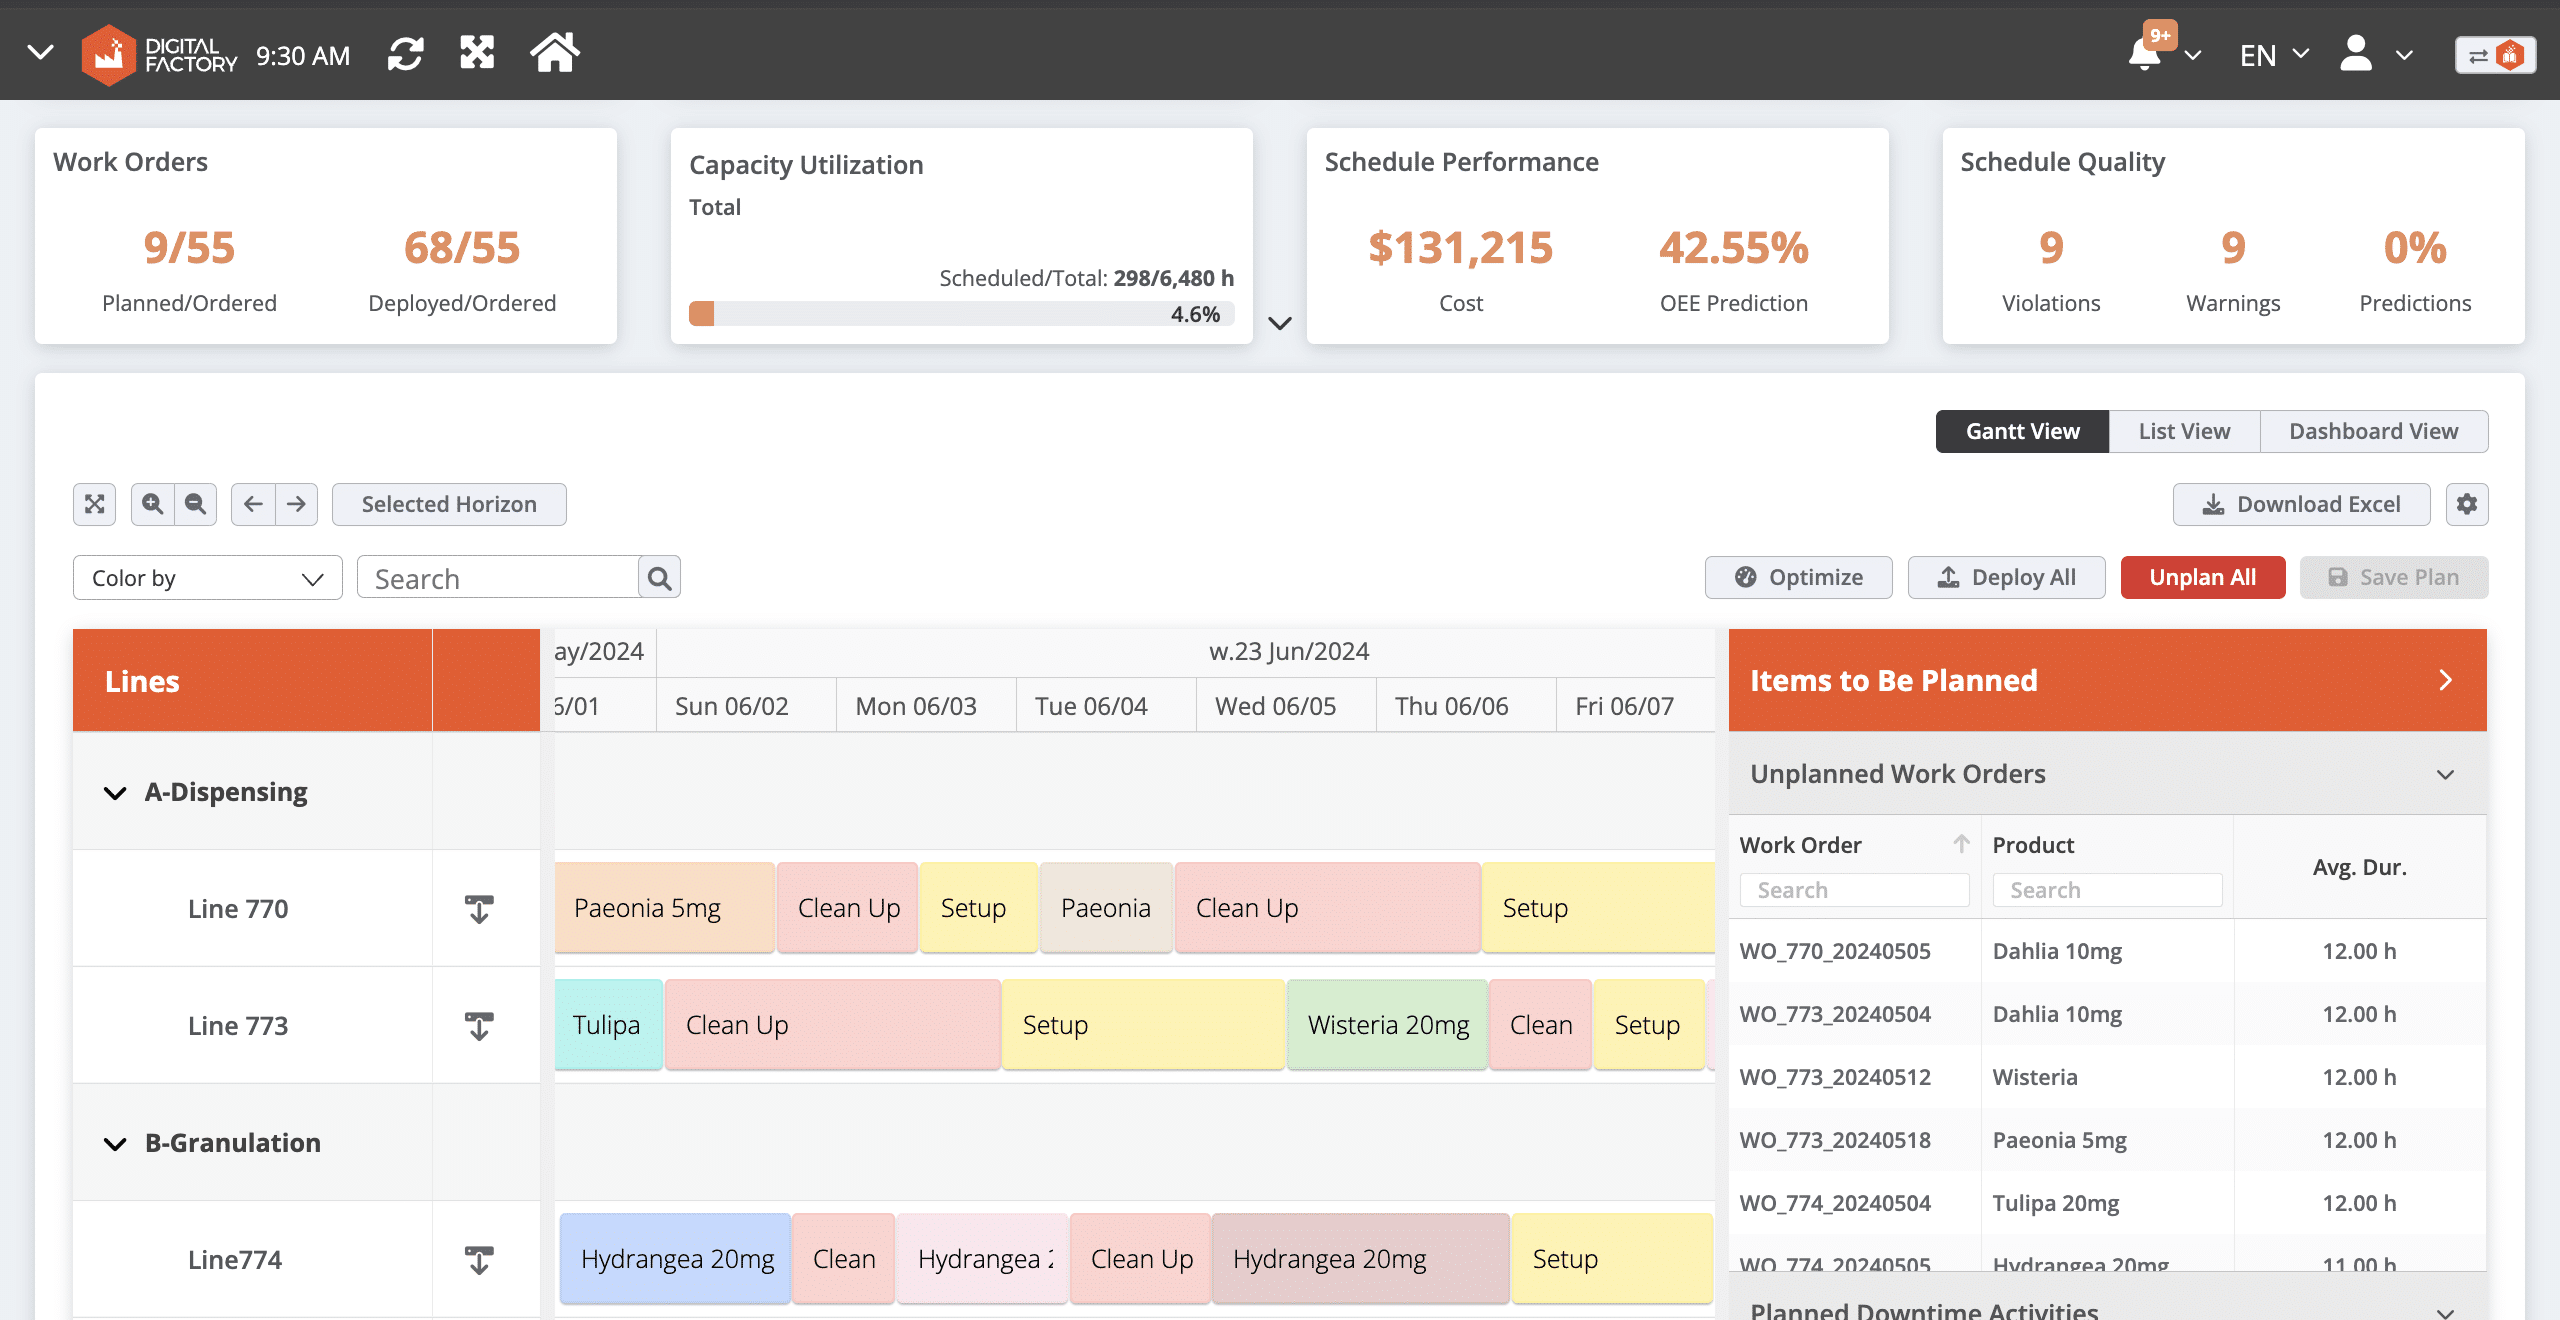
- User-Friendly Digital Interface: As seen in the image below, production scheduling systems provide planners with a user-friendly, digital interface that facilitates effective, data-driven scheduling.
- Efficient Scheduling Algorithms: AI-powered scheduling algorithms can solve complex job shop scheduling problems with a focus on minimizing changeovers more efficiently than humans. For example, a Boston Consulting Group analysis found that AI schedulers generate an additional 30 minutes of productive time per day by optimizing changeovers compared to human schedulers.
3. Digitize Your Total Productive Maintenance
Unplanned downtimes due to machine failures are often linked to various data points that can be collected from the shop floor. Key metrics such as mean time between failures, mean time to repair, equipment vibration levels, humidity, and the specific workers operating the machines all serve as critical inputs for determining maintenance needs.
As shown in the video below, modern Maintenance Modules offer real-time data on machine health and provide a user-friendly interface for scheduling maintenance tasks, effectively digitizing total productive maintenance.
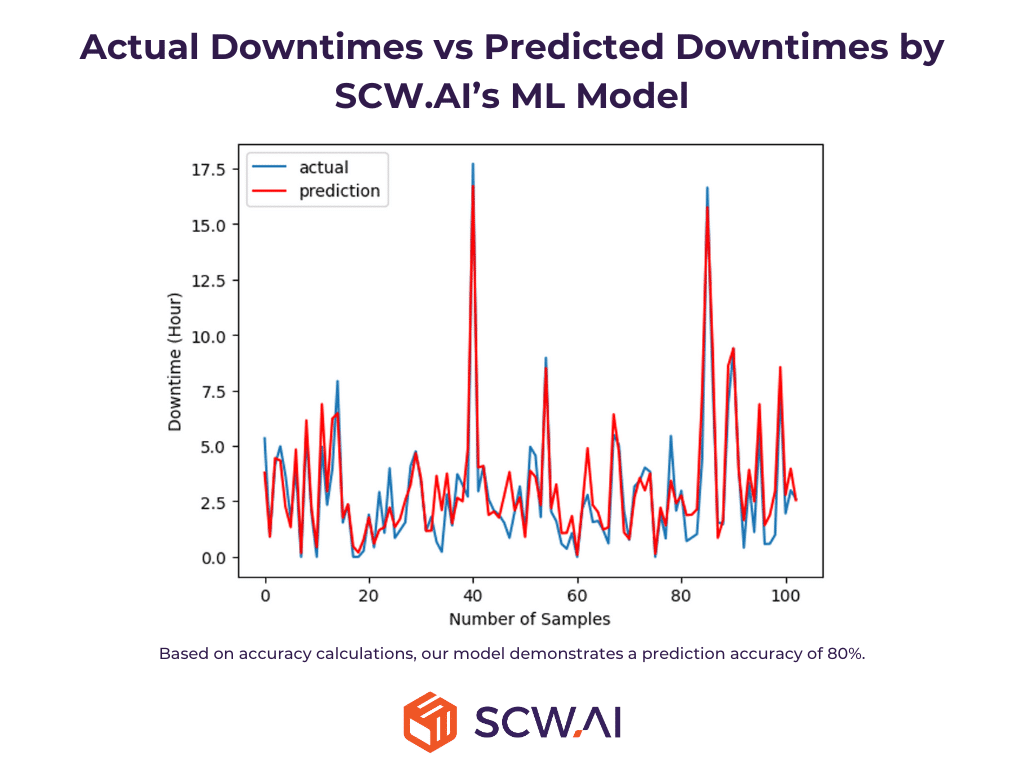
Another cutting-edge approach to enhancing total productive maintenance is using machine learning-driven predictive maintenance. These ML algorithms minimize unplanned downtime by scheduling maintenance activities just before a failure occurs, without increasing maintenance costs. For instance, a World Economic Forum study found that Johnson & Johnson was able to cut unplanned downtime by half using predictive maintenance models. This way manufacturers can improve production quality while reducing costs that helps industrial organizations towards world class manufacturing.
4. Embrace Paperless Manufacturing
Paperless manufacturing enhances productivity in three key ways:
- Standardization: Digital Forms provide laborers with user-friendly checklists for workflow management. Additionally, administrators can upload SOP documents, videos, or images that guide operators in completing tasks with high accuracy. This approach further standardizes production steps, minimizing quality losses.
- Minimization of Non-Value Added Tasks: Documentation, while essential for smooth work order management and industry compliance (such as in pharma), is often a tedious, non-value-added task. Digital Logbook or Digital Batch Records can reduce documentation time by up to 85%. This time savings allows manufacturers to focus more on value-added tasks like production, thereby enhancing capacity.
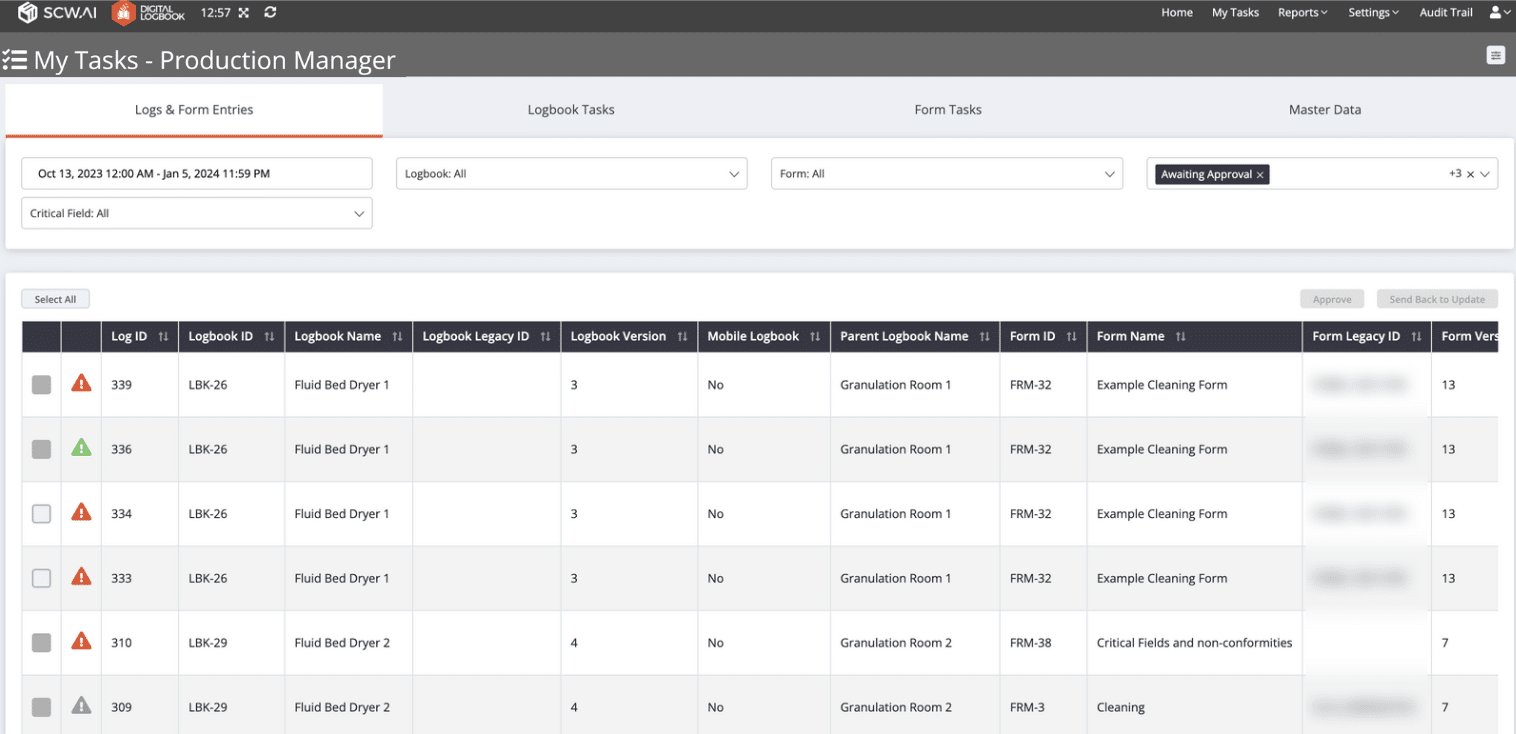
- Quick Approval Process: Waiting for approval from a superior can sometimes halt production, as like unplanned downtime. Paperless manufacturing solutions send notifications to users about pending approvals, speeding up the process and minimizing delays (see image below).
Utilize Digital Factory Platform to Maximize Your Production Capacity
The Digital Factory Platform is a scalable, cloud manufacturing solution that offers end-to-end digitalization for factories. We enhance production capacity through the following modules:
If you have any questions about production capacity or our Digital Factory Platform, feel free to contact us.
To experience the transformative power of the Digital Factory Platform, book a demo today.