According to a McKinsey study, the journey toward operational excellence and maximum productivity is closely linked to continuous process improvement, where manufacturers consistently aim to outperform their past performance. However, a significant challenge many manufacturers face is the lack of automated dashboards and reports (manufacturing analytics) that seamlessly compare production efficiency across different time periods.
SCW.AI’s Digital Factory Platform addresses this challenge by offering 50+ manufacturing analytics that enable manufacturers to identify and tackle bottlenecks without the need to manually sift through data on spreadsheets. Our latest addition to the platform, the OEE Adherence Report, empowers manufacturers with actionable insights at a glance, bridging the gap between actual and targeted efficiency.
In this article, we will introduce the OEE Adherence Report and delve into the key manufacturing KPIs it highlights. We will then explore its practical applications on the shop floor, and conclude by showcasing how our cloud manufacturing solutions can enhance your efficiency, production capacity, and agility.
What is the OEE Adherence Report?

The OEE Adherence Report is a new feature within the OEE Tracker Module of Digital Factory that enables users to accurately measure the efficiency of production processes by comparing expected and actual OEE values in real-time. By automating the calculation of Expected OEE, this report helps manufacturers quickly identify whether unplanned downtime is causing production slowdowns. Additionally, through deeper analysis by using OEE Tracker, executives can uncover issues such as changeover inefficiencies, setup errors, or micro stops that contribute to deviations from expected OEE.
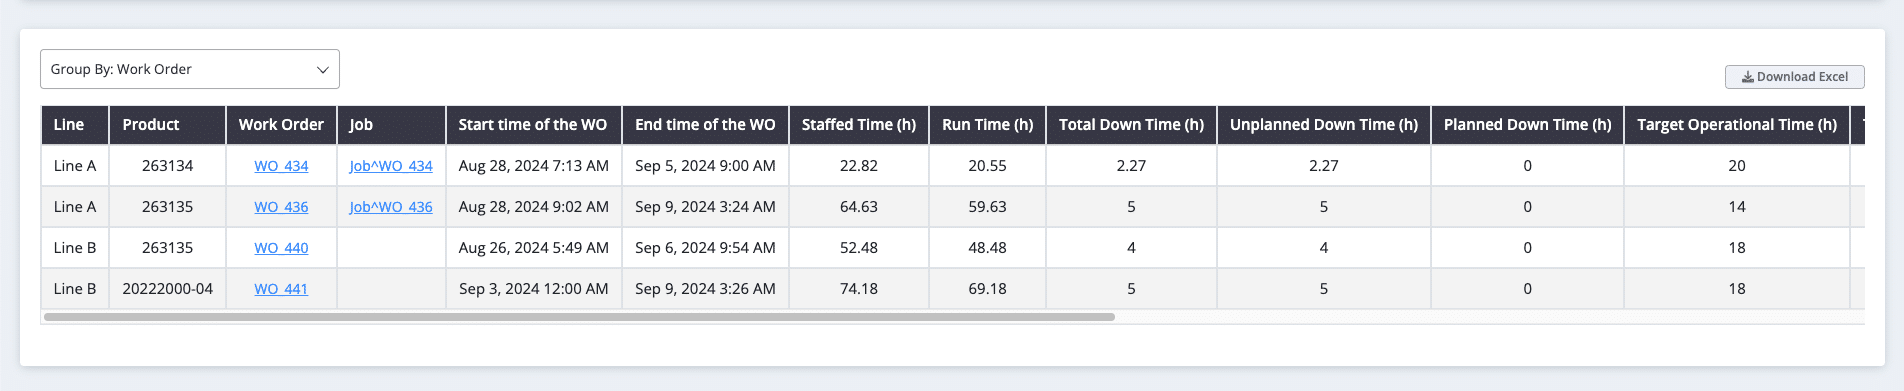
This report provides granular data for specific product families, work orders, and production lines within selected time intervals, allowing for the swift identification of ineffective production elements. Once the primary pain points are pinpointed, manufacturers can take targeted actions to address them.
Moreover, by adjusting the “Target Speed” input for certain lines and product families, manufacturers can progressively enhance their expected OEE values over time. As a result, the OEE Adherence Report supports continuous improvement initiatives of organizations by setting new, measurable targets, propelling their production facilities away from inertia towards sustained operational excellence.

Explore 5 Essential KPIs with the OEE Adherence Report
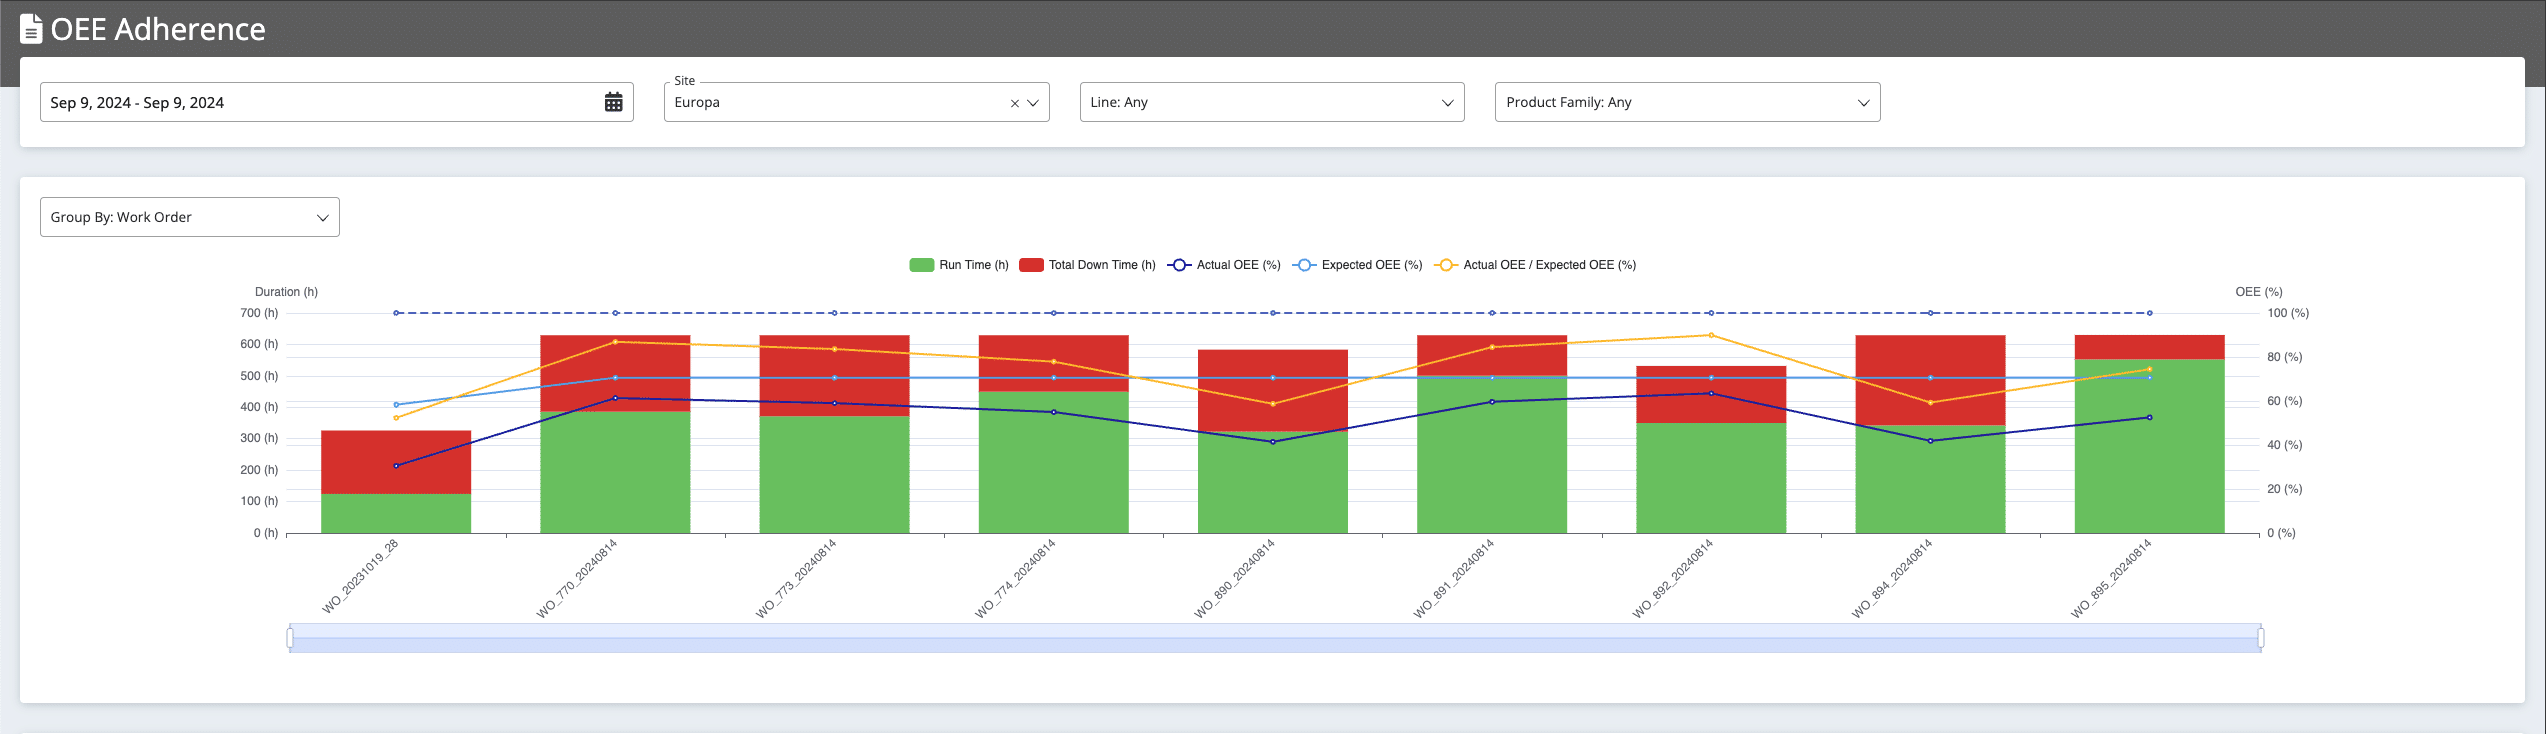
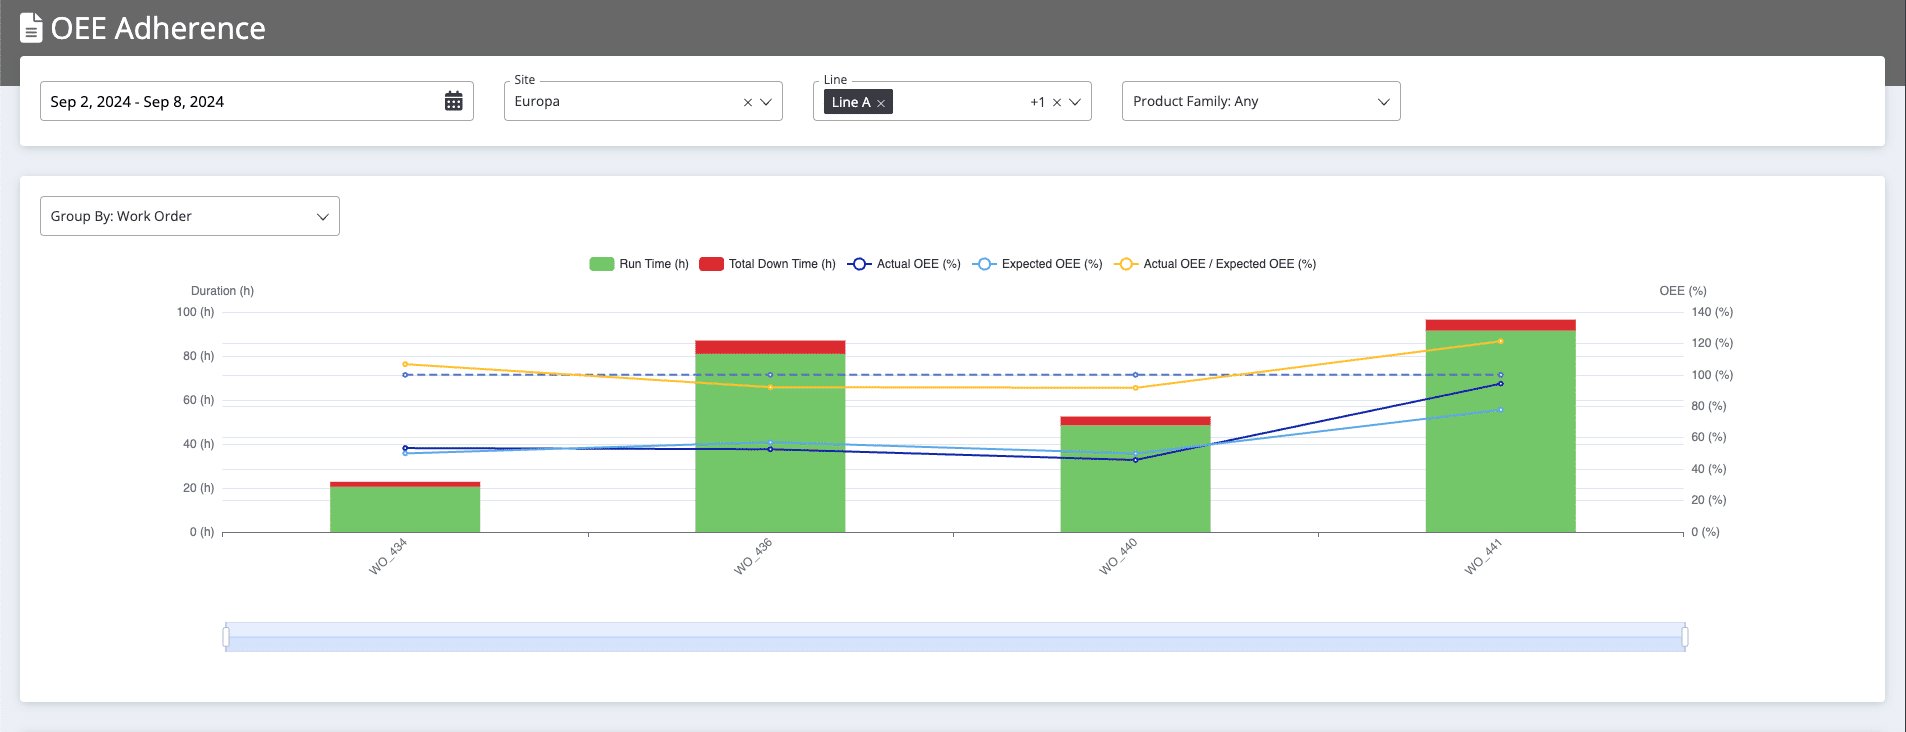
The OEE Adherence Report provides a quick overview of five essential KPIs that are crucial for understanding and optimizing production efficiency:
1. Actual OEE
Represented by a dark blue line, this metric shows the actual OEE values for each production line, work order, or product family over a selected time interval.
2. Expected OEE
Shown as a light blue line, Expected OEE serves as a benchmark, automatically calculated using inputs such as work order quantity, production speed per minute, scheduled pre-run and post-run activities. This proxy OEE value helps manufacturers compare actual performance against planned targets. For more details on its calculation, please see the following section.
3. Actual OEE vs. Expected OEE
Indicated by a yellow line, this comparison metric reveals the ratio of actual OEE to expected OEE. A value of 100% suggests that production proceeded as planned, while values below 100% indicate higher-than-expected losses in availability, performance, or quality. Conversely, values consistently above 100%, while seemingly positive, may highlight issues such as inaccuracies in master data, underutilization of capacity, or misjudgment of equipment and labor performance, signaling that the shop floor may have the potential to produce more.
4. Runtime Duration
Represented by green bars, this metric indicates the duration of effective production. Ideally, a successful production batch should be primarily covered in green, indicating greater runtime with minimal interruptions.
5. Downtime Duration
Shown as red bars, this metric reflects the extent of unplanned downtime. A larger red area within a time interval indicates that more work orders were affected by downtime, negatively impacting schedule adherence and potentially leading to OTIF penalties.
Additionally, the report provides log entries for each monitored work order, complete with links. Executives seeking to perform a deeper analysis of specific work orders to identify root causes can click these links to access further production monitoring details beyond the initial diagnosis.
If you operate in the pharmaceutical industry, we recommend reading our article, World Class OEE in Pharma: A Benchmarking Analysis, to uncover the production losses typical firms experience and how Pharma 4.0 companies nearly double their OEE compared to average pharma manufacturers.
Calculation of Expected OEE
In the OEE Adherence Report, the proxy metric “Expected OEE” plays a critical role, making it essential to understand its automated calculation within the tool.
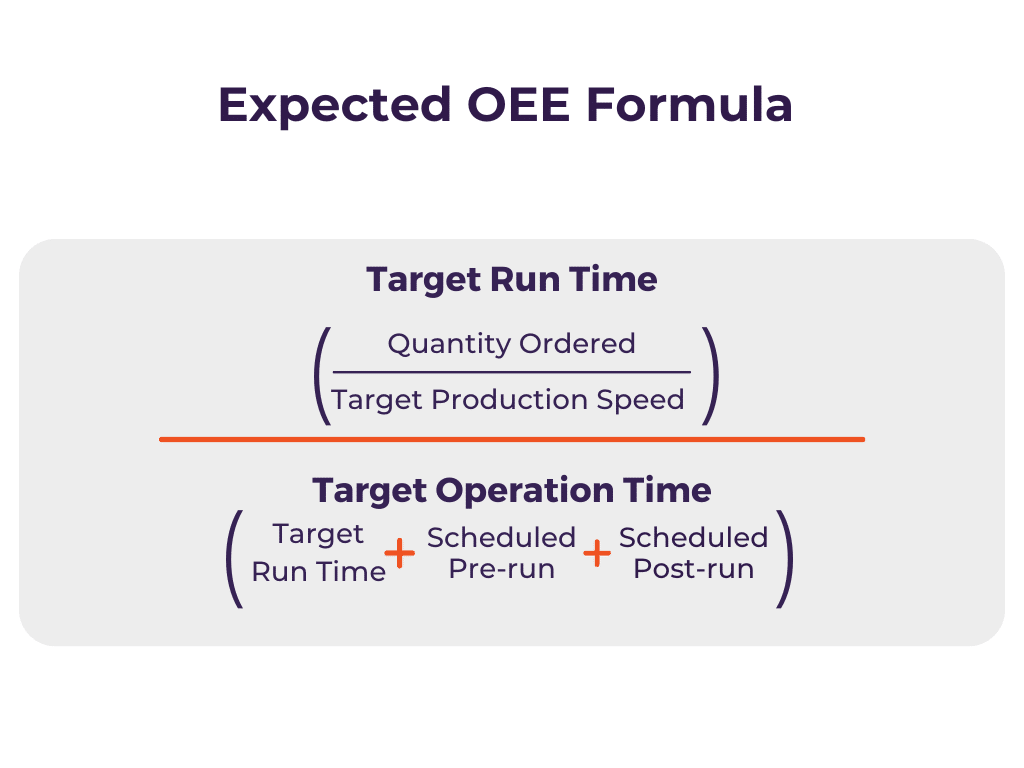
Expected OEE is calculated by dividing the target run time by the target operation time. The target run time is automatically determined for each work order or production line by dividing the work order quantity by the target speed per minute, a value that executives can input directly into the OEE Tracker.
On the other hand, the target operation time encompasses the sum of scheduled pre-run, post-run and target run durations. These periods include planned maintenance activities, equipment setups, and line cleaning tasks on top of runtime. For further clearance, the complete calculation of Expected OEE is illustrated in the image below.
Check out our in-depth Manufacturing KPIs Handbook, packed with clear breakdowns and formulas for over 60 essential performance metrics, including OEE Adherence. Download your copy today!
Top 4 OEE Adherence Use Cases
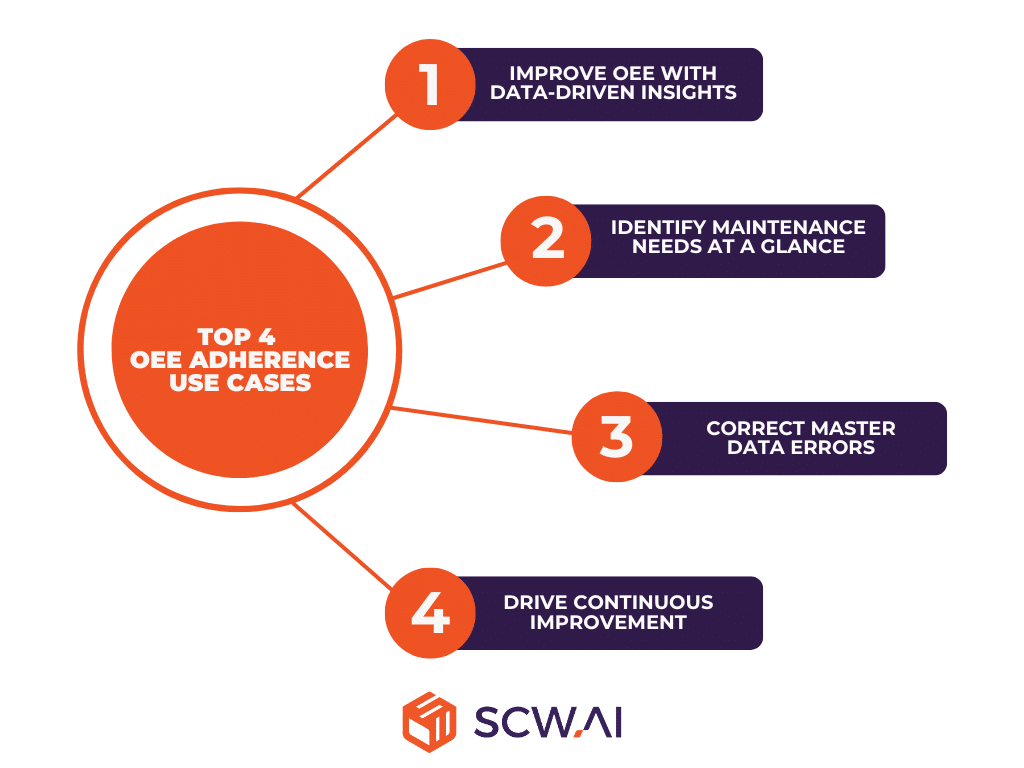
1. Improve OEE with Data-Driven Insights
As mentioned earlier, when product categories or production lines consistently show Actual OEE vs. Expected OEE values below 100%, it signals a productivity issue that needs to be addressed. If the primary cause of low Actual OEE is unplanned downtime, manufacturers can quickly identify this problem by monitoring the OEE Adherence Report. However, if the reduction in OEE is due to activities like line cleaning, planned maintenance, or equipment setup, further analysis using our OEE Tracker is essential.
Once the root cause is identified, manufacturers have numerous opportunities to address inefficiencies, leveraging Industry 4.0 technologies, such as:
- Minimizing Unplanned Downtime: Implement machine learning-driven predictive maintenance to anticipate equipment failures and schedule repairs proactively, reducing unexpected stoppages.
- Reducing Changeover Periods: Utilize AI-driven Schedulers that automatically group and schedule similar product families for more efficient job shop scheduling.
- Optimizing Planned Maintenance Durations: Use our Maintenance Module, which provides real-time information on machine health, environmental conditions, and key metrics such as mean time between failures, to streamline maintenance processes.
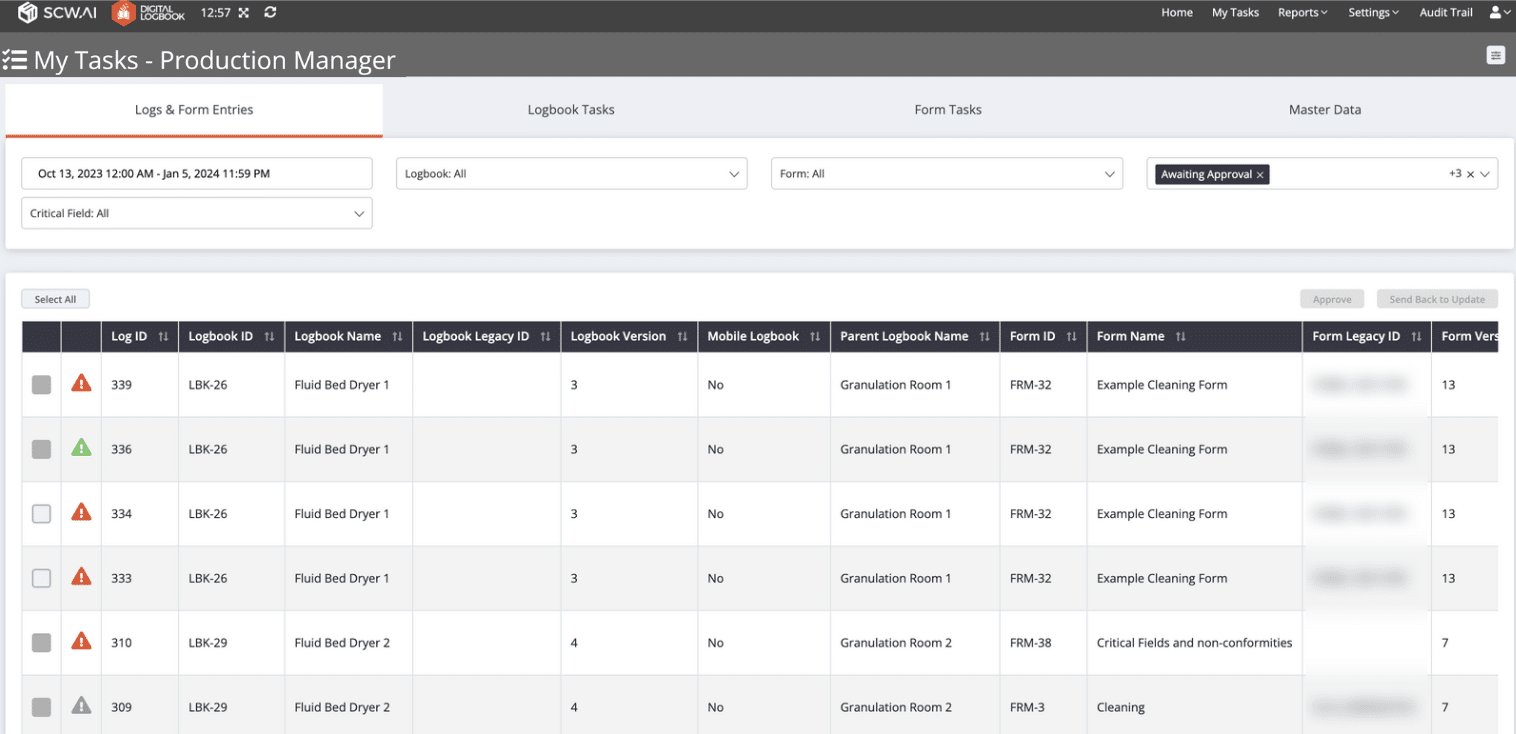
- Streamlining Documentation and Reporting: If documenting shop floor activities is time-consuming, it can be expedited through paperless manufacturing solutions like Digital Logbook or Digital Forms, ensuring quicker and more accurate reporting (See Image Below).
2. Identify Maintenance Needs at a Glance
By utilizing the OEE Adherence Report for monitoring current values, manufacturers can quickly identify high levels of unplanned downtime, represented by red columns. These indicators suggest frequent equipment failures for specific work orders. Since the report specifies the production lines associated with these work orders, manufacturers can direct their maintenance teams to the exact machines that require adjustments. This targeted approach allows producers to address maintenance needs promptly, leading to improved efficiency and enhanced quality metrics, such as first pass yield.
3. Correct Master Data Errors
An efficiently functioning factory is characterized by executives who are aware of potential bottlenecks in the production process and account for these issues during the planning phase. This approach ensures that the shop floor operates at an optimal level—neither underproductive nor overproductive. As a result, plans are executed as intended, delivery schedules are met without delays that could harm customer relationships, and manufacturers can fully leverage their capabilities to meet additional demand.
However, if the Actual vs. Expected OEE consistently exceeds 100%, it indicates that the shop floor is more productive than manufacturers have assumed. This discrepancy suggests that machines are running faster than expected, with a higher production rate per minute, or that pre-run and post-run durations are shorter than the values entered into the Digital Factory Platform.
In such cases, the master data is inaccurate, leading to underutilized resources. By correcting these master data values for the affected lines, manufacturers can develop more realistic schedules, accurately calculate their production capacity and ensure line balancing.
4. Drive Continuous Improvement Through Self-Competition
Another scenario for the Actual vs. Expected OEE comparison is when Actual OEE was previously below Expected OEE, but over time, they converge due to a positive trend. This alignment is a strong indicator that the manufacturer’s digital lean initiatives have successfully identified and addressed chronic bottlenecks, leading to a new, higher level of productivity on the shop floor.
However, there is always room for further improvement. The OEE Adherence Report encourages continuous improvement in such scenarios by promoting self-competition. Manufacturers can adjust their master data to set a higher OEE target as a new benchmark. By comparing actual performance against this updated proxy metric, manufacturers can foster a culture of self-competition, driving sustainable increases in OEE and continuously pushing the boundaries of their production capabilities.
Affordable and Scalable Factory Transformation with SCW.AI
The Digital Factory Platform is an end-to-end solution specifically designed to meet the needs of shop floors, offering comprehensive support in the areas of:
- Production Monitoring
- Execution
- Compliance
- Planning
- Sustainability
- Intelligent Automation in the era of Industry 4.0
Unlike traditional MES systems, the Digital Factory Platform is a cost-effective solution that can be deployed within your company in under 100 days, providing a quicker return on investment while addressing your specific operational challenges.
If you have further questions about the Digital Factory Platform, the OEE Adherence Report, or the OEE Tracker Module that includes this report, please feel free to contact us.
To have a factory of the future you can book a demo today.