Reducing manufacturing costs and increasing throughput both begin with a clear understanding of why production time is being lost. For decades, Overall Equipment Effectiveness (OEE) has served as the standard metric to quantify losses linked to Availability, Performance, and Quality. Yet in today’s complex manufacturing environments, the real challenge lies in tracking OEE in real time, identifying deviations instantly and uncovering root causes before they grow into chronic inefficiencies.
While relying on paper records and spreadsheets makes real-time OEE tracking difficult, even partnering with a standard line monitoring software may not solve everything: its generic definitions might not exactly match your unique, business-related definition of losses for OEE1, OEE2, and OEE3. This mismatch creates inconsistencies in how OEE1, OEE2, and OEE3 are defined, recorded, and benchmarked across sites, complicating performance comparisons and continuous improvement initiatives.
SCW.AI closes this gap with a major enhancement to its OEE Waterfall Analysis. The new capability enables fully customizable OEE1, OEE2, and OEE3 structures, along with TEEP, all monitored in real time. Built on a scalable SaaS architecture, it empowers manufacturers to harmonize performance tracking across every site, line, and region—achieving true global consistency in operational visibility.
In this article, we introduce manufacturing professionals how our Waterfall Analysis revolutionizes loss identification and data-driven decision making with examples and detailed explanations.
SCW.AI’s Custom OEE1, OEE2, OEE3 Waterfall Analysis
The SCW.AI Waterfall Analysis is a core component of the monitoring module within our end-to-end Digital Factory Platform, serving as an insightful manufacturing analytic in our OEE Tracker software.
With the latest enhancement, SCW.AI introduces a display mode for OEE1, OEE2, and OEE3 waterfall analysis, extending beyond standard OEE and TEEP metrics. This evolution enables manufacturers to move rigid, pre-defined downtime codes, an essential step toward implementing advanced lean manufacturing strategies, making smarter investment decisions, and driving targeted workforce upskilling initiatives.
Every plant operates differently. Product mixes, shift structures, and maintenance strategies all shape a factory’s unique loss profile. SCW.AI’s solution acknowledges this diversity by giving manufacturers the flexibility to define, categorize, and monitor custom loss items exactly where they belong within the OEE1, OEE2, and OEE3 framework. The result: data that truly mirrors each site’s operational reality and provides actionable insights for continuous improvement.
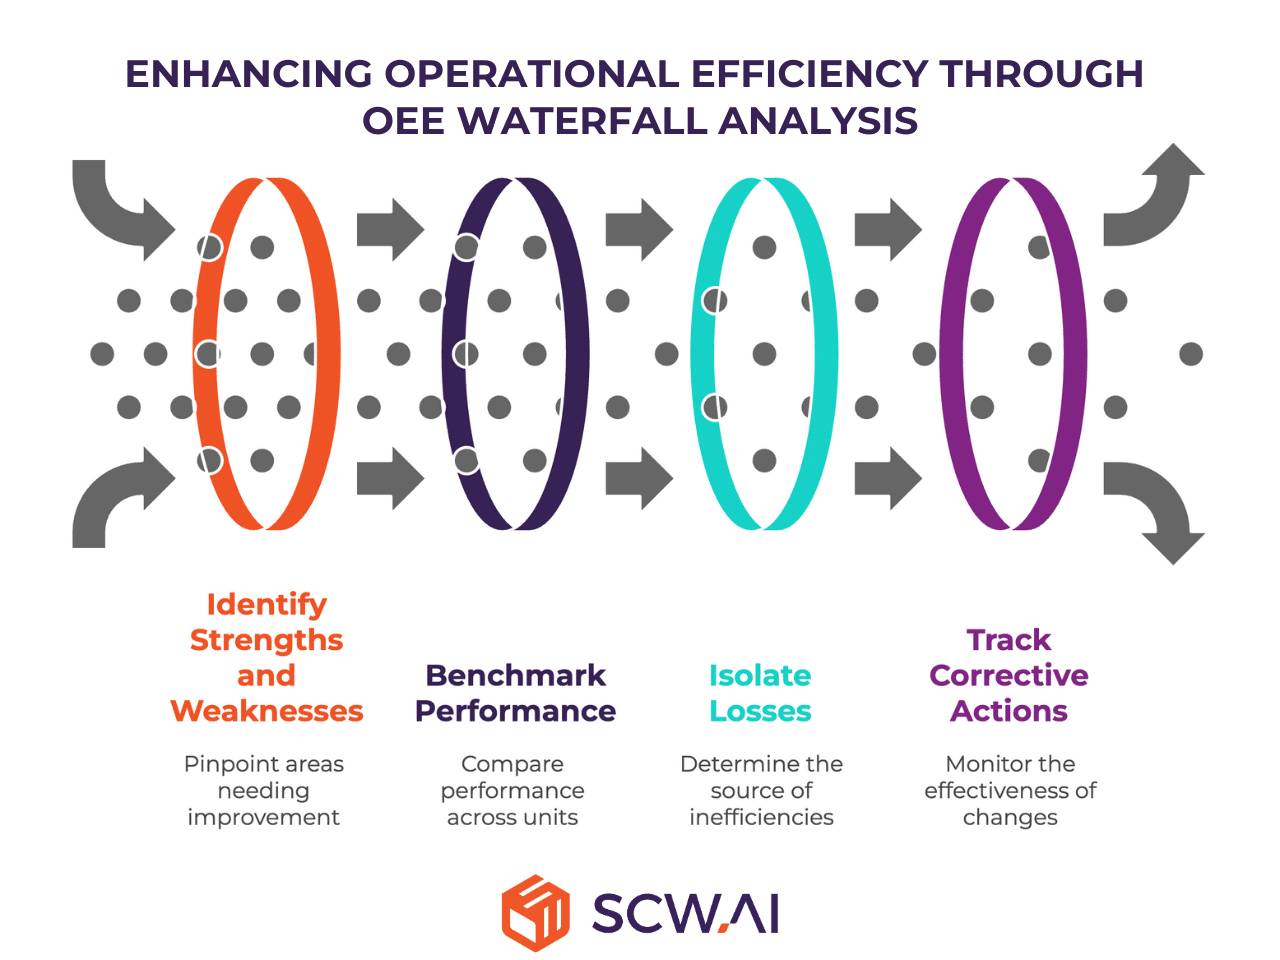
This level of configurability empowers managers to:
- Pinpoint strengths and weaknesses for each line, site, or department.
- Benchmark performance across regions or business units with consistent logic.
- Isolate whether losses stem from planning, shop floor operations, or supply chain issues.
- Track the impact of corrective actions with granular, historical performance insights.
Manufacturers can now evaluate productivity and efficiency seamlessly across:
- TEEP
- OEE1
- OEE2
- OEE3
Control the Narrative: Defining Your Factory's Unique OEE1, OEE2, OEE3
Traditional OEE systems often impose rigid, one-size-fits-all definitions that rarely align with real factory operations. This rigidity leads to data misinterpretation, inconsistent benchmarking, and ultimately poor decision-making. SCW.AI reverses this logic—our platform adapts to your business rules, not the other way around.
With Customizable OEE1, OEE2, OEE3 Waterfall Analysis, manufacturers can redefine how specific losses impact each OEE level, depending on site-specific or regional definitions. You gain:
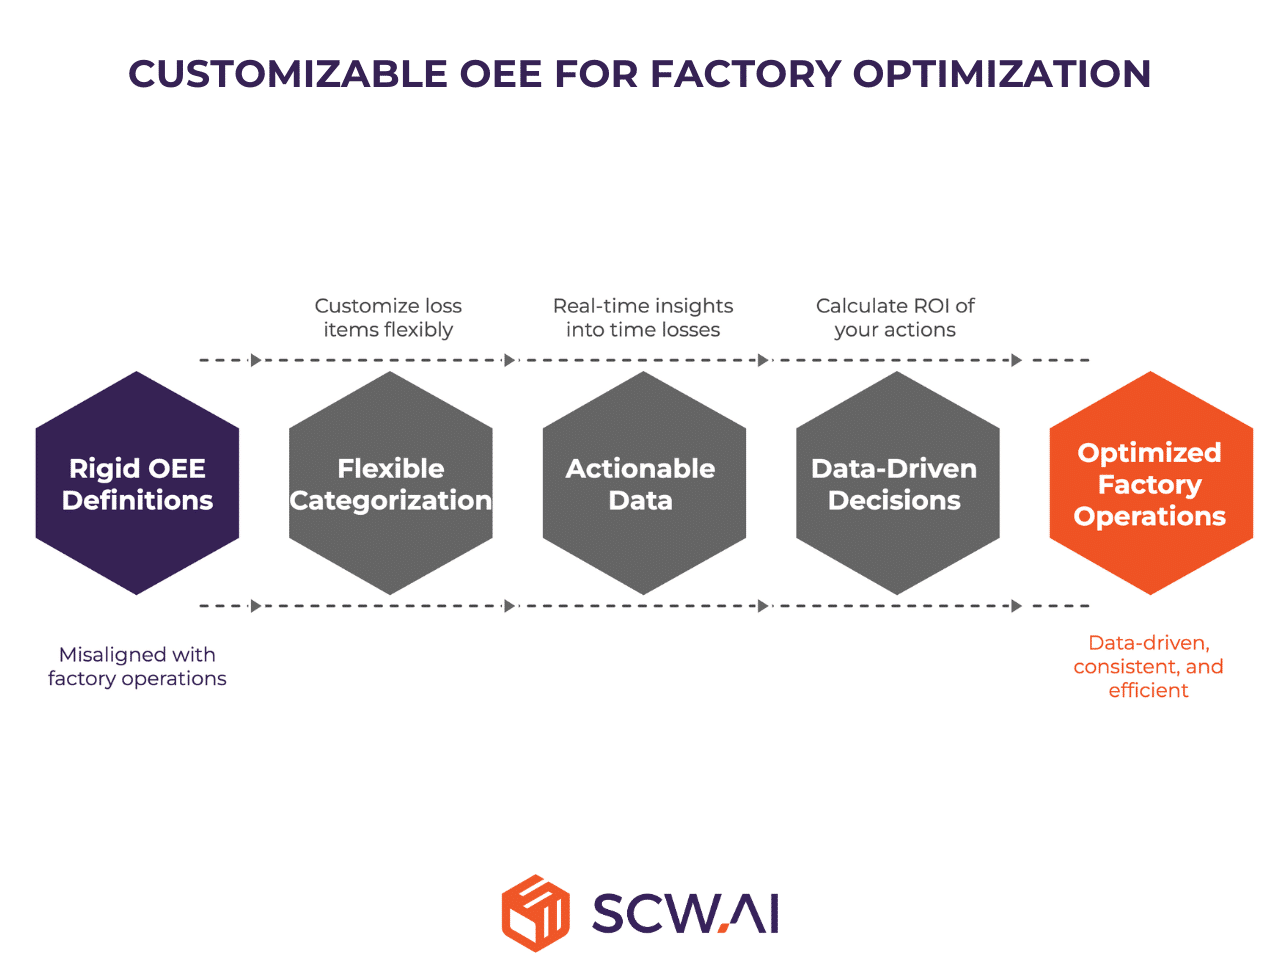
- Dynamic Categorization: Flexibly assign customized loss items under OEE1, OEE2, or OEE3 to match internal reporting standards across global sites.
- Actionable Data: Move beyond general downtime reasons and see, in real time, which exact activities cause time losses, accelerating root-cause analysis and optimization.
- Data-Driven Investment Decisions: For example, if 10% of staffed time is lost to manual paperwork, the data helps calculate the ROI of implementing a Digital Logbook or Digital Batch Record, especially when reporting durations can be reduced by 70–90%.
Why There Is No Universal Standard for OEE1, OEE2, and OEE3 Definitions
Each industry—and even each factory within the same enterprise—has distinct operations, regulations, and production rhythms. As a result, loss classifications, especially those tied to availability, vary significantly.
While Performance and Quality losses tend to follow common rules (e.g., micro-stops and speed losses are deducted from run time as performance losses, while scrap and rework time reduce net run time), Availability losses are far more nuanced—and this is what differentiates OEE1, OEE2, and OEE3.
Here’s how they generally break down:
- OEE1: Captures unplanned downtime, such as machine breakdowns, equipment malfunctions, or power failures. This level also includes standard performance and quality losses, providing the base layer of production efficiency.
- OEE2: Adds planned but non-productive time—activities necessary to continue production but not producing output. Examples include set-ups, planned maintenance, line cleaning, material wait times, quality holds, or paperwork. These losses vary widely by sector: a biologics manufacturer may require product-hold periods for efficacy validation, while a pencil producer would never face such downtime.
- OEE3: Includes contextual or semi-productive losses—the gray area between idle time and necessary preparation. This might include short breaks between batches that enhance quality control, or routine tier meetings that ensure operational alignment. Depending on each factory’s processes, these may or may not be tracked as OEE3 losses.
What matters most is the ability to clearly identify and measure every activity on the shop floor, evaluate its trade-offs, and continuously improve overall productivity.
Examples of Custom Loss Items
With SCW.AI’s customizable structure, manufacturers can create and monitor an unlimited number of context-specific loss items, ensuring each data point ties directly to an improvement opportunity.
For example, as shown in the image below a pharmaceutical manufacturer may define:
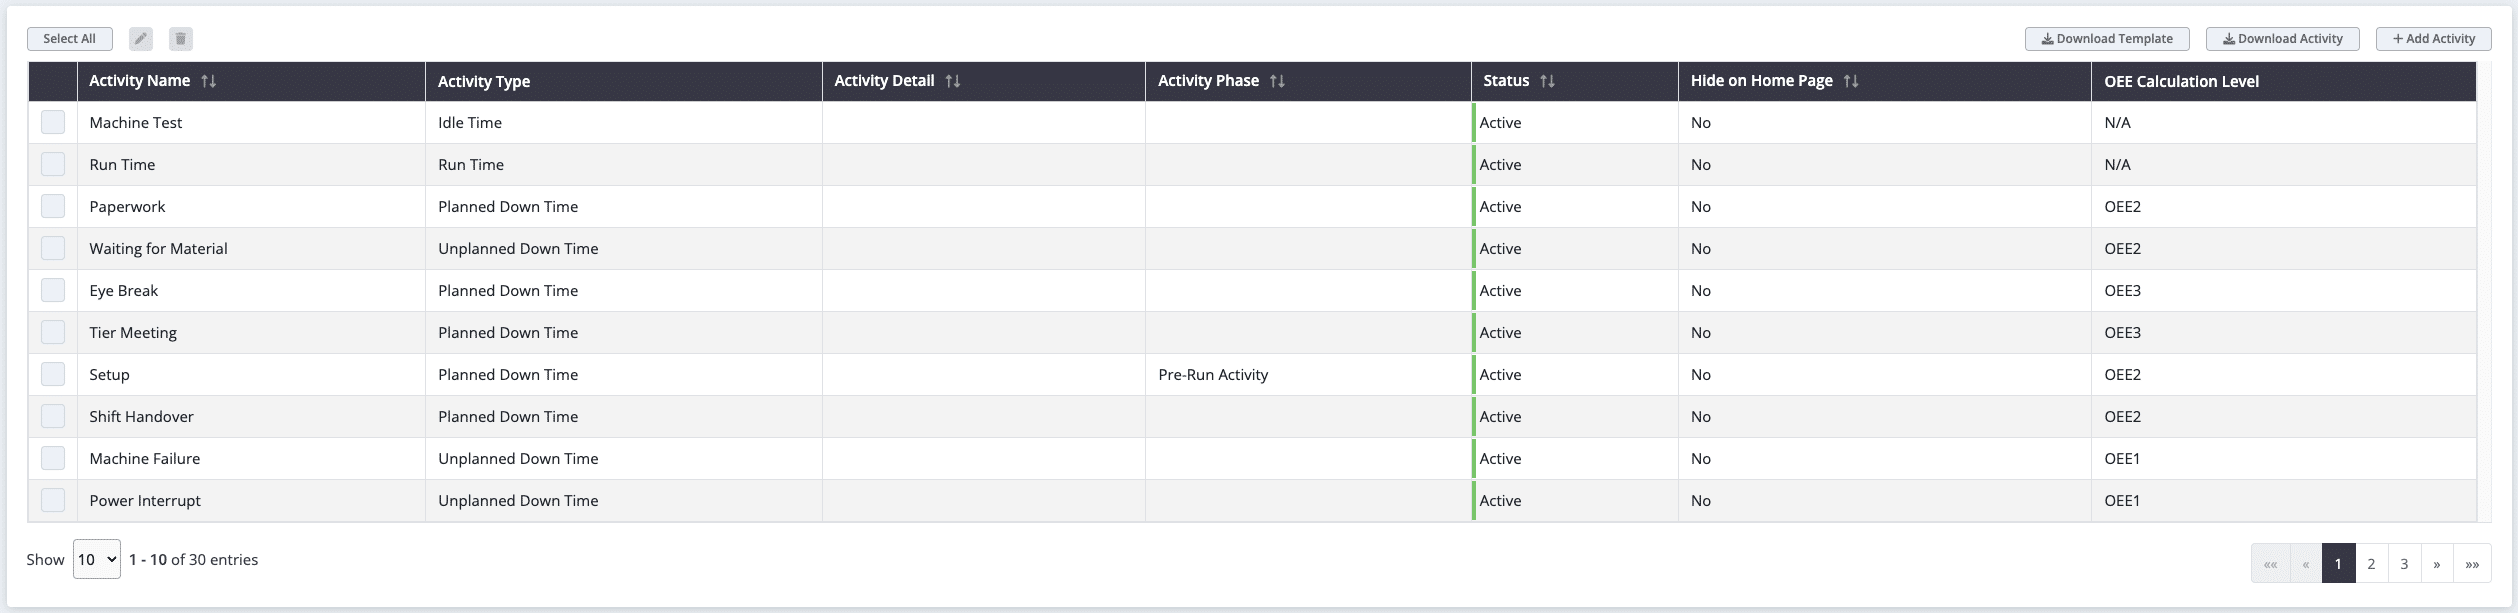
- OEE1 Availability Losses: Unplanned equipment failures, power interruptions etc.
- OEE2 Availability Losses: Line cleaning, set-up, waiting on materials, paperwork etc.
- OEE3 Availability Losses: Tier meetings, eye breaks, periodic maintenance etc.
This flexibility ensures that each factory’s operational reality is accurately represented—and optimization projects can be precisely targeted.
When Standard OEE Categorization Falls Short
Traditional OEE and TEEP analysis deliver an essential overview of production efficiency—revealing how much time is lost to idle time, availability, performance, or quality issues. However, when deeper insights are needed, standard OEE categories alone are insufficient to pinpoint where and why those losses occur.
The OEE1–OEE2–OEE3 structure provides the missing clarity. For instance:
- If OEE1 remains stable but OEE2 declines, potential causes might include supply chain delays, extended changeover times, or prolonged paper work; not unplanned downtime.
- Conversely, if planned maintenance durations rise and OEE1 improves, this indicates that total productive maintenance measures are paying off—machines are running longer and more reliably.
This layered visibility strengthens root-cause analysis and fosters accountability across departments. Each team can focus on the losses within their control—maintenance on OEE3, planning and quality on OEE2, and operations management on OEE3—to drive operational excellence.
If you wonder about other 60+ manufacturing KPIs which can be crucial for assessing your business we recommend you to download our free Manufacturing KPIs Handbook!
Applying OEE Waterfall Analysis in Real Life
To demonstrate how OEE Waterfall Analysis translates into practical insights, let us consider a real-world scenario—an example pharmaceutical manufacturer operating under batch production principles.
The factory’s loss structure is defined as follows:
- Quality Losses: Scrap
- Performance Losses: Micro-stops and speed losses together
- OEE1 Availability Losses: Machine failures, power interruptions
- OEE2 Availability Losses: Line cleaning, setup, waiting on materials, paperwork, shift handover
- OEE3 Availability Losses: Tier meetings, eye breaks, planned maintenance
- TEEP: Unscheduled time, machine testing
Over a one-week production period, the results of the OEE Waterfall Analysis aligned closely with industry-standard benchmarks from our World-Class OEE Database for the pharmaceutical sector:
- TEEP: 25%
- OEE3: 37%
- OEE2: 43%
- OEE1: 56%
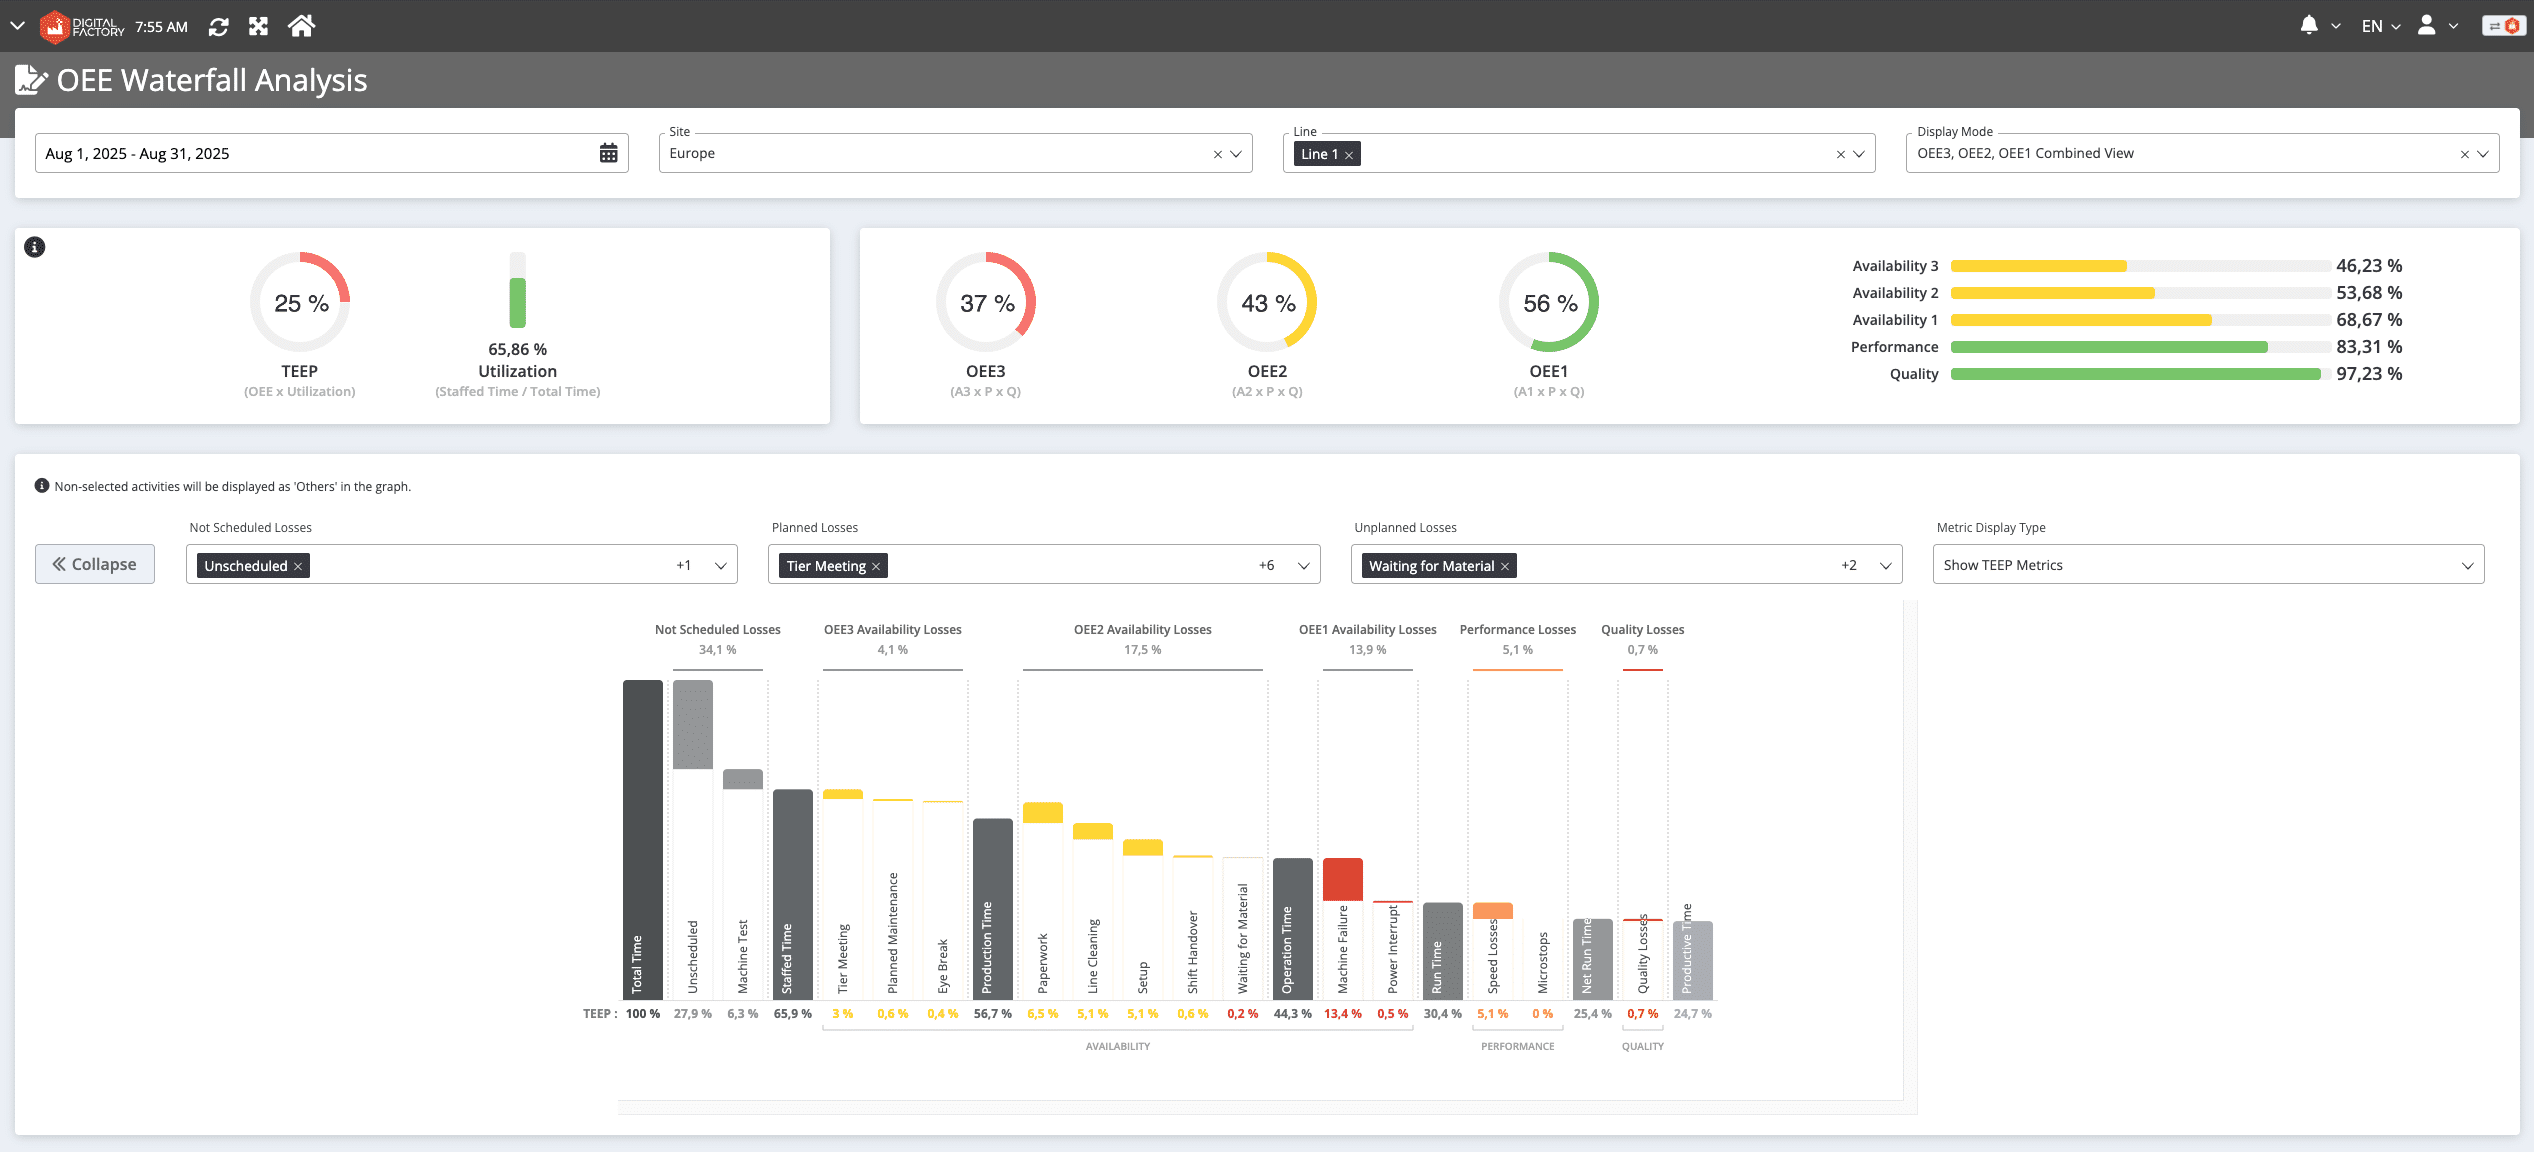
The waterfall breakdown revealed several crucial loss drivers:
- Unscheduled time (idle line)
- Tier meetings
- Line cleaning
- Setup activities
- Paperwork
- Machine failures
- Performance Losses
These results give managers a direct, data-backed view of where productivity is leaking and how to act strategically. Below are some targeted improvement opportunities drawn from this analysis.
Minimizing Line Cleaning and Setup Losses
Both are labor-intensive and time-sensitive tasks. A first step is to identify which operators excel at these activities and who may need additional training. Our Labor Analytics can highlight performance variances between operators, comparing each person’s setup and cleaning durations against target or average values.

Underperformers can then receive targeted training to standardize best practices and reduce time losses.
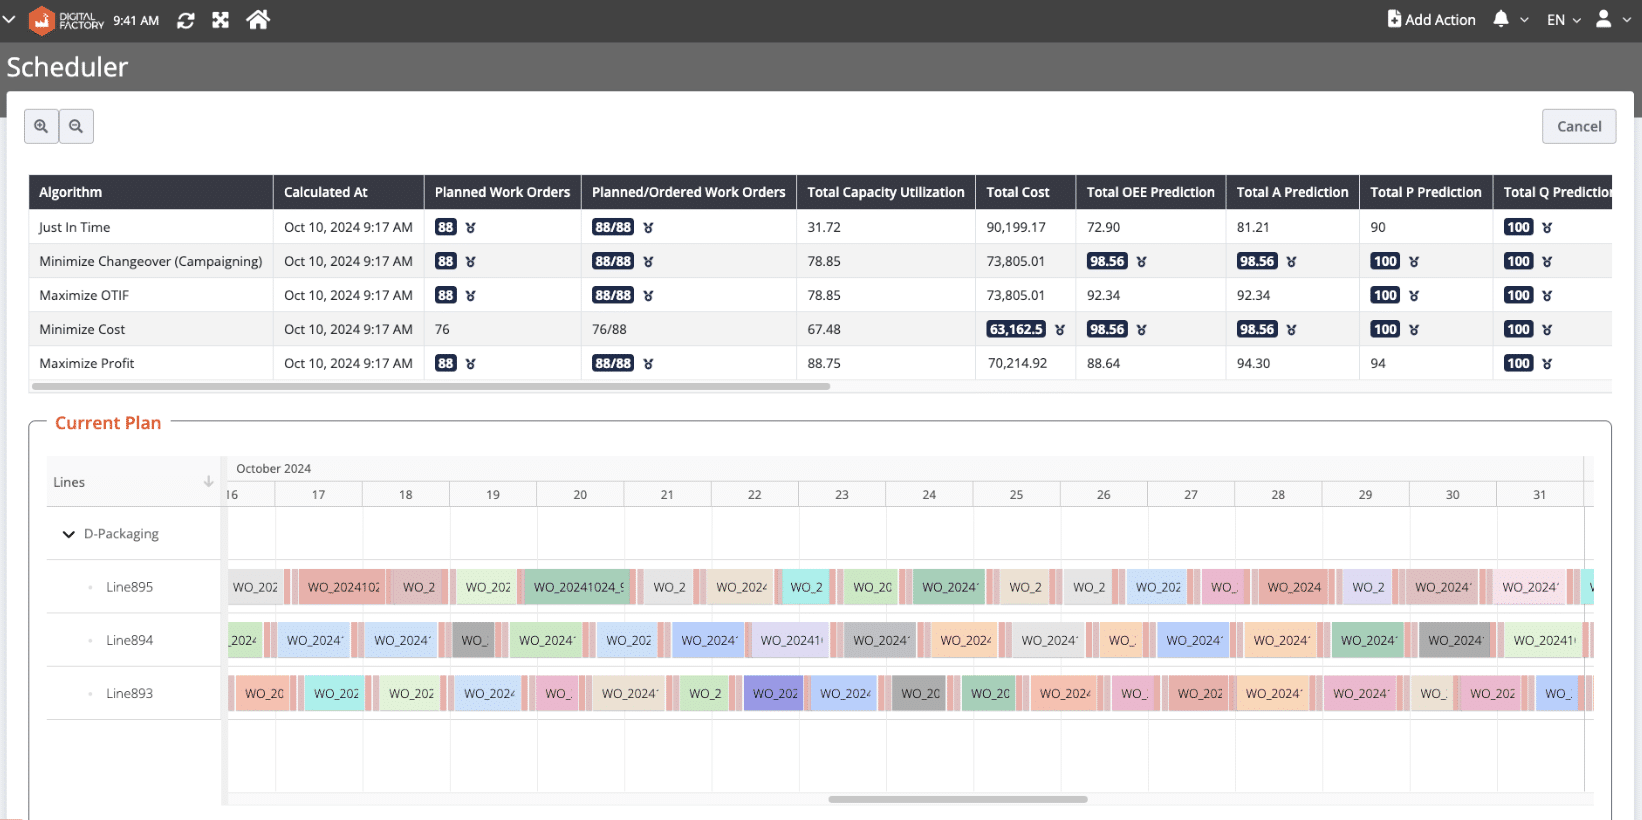
Once labor data accumulates, manufacturers can build real-time skill matrices. Planners can leverage these for labor-aware scheduling, assigning the most skilled operators to setup or cleaning tasks—further minimizing downtime.

For even greater optimization, AI-based scheduling algorithms can apply changeover minimization logic, sequencing similar product families consecutively to reduce the number and duration of major changeovers.
Minimizing Paperwork Losses
Paperwork is another hidden time sink in many pharmaceutical environments. Using labor analytics, manufacturers can measure the actual time spent on reporting versus targets, identify bottlenecks, and design focused interventions.
A more transformative approach is to digitize these processes through Digital Logbooks, Electronic Batch Records, and Smart Forms. These digital tools enable:
- Predefined templates and auto-calculated batch yields.
- Smart rules that automate data entry and verification.
- Seamless integration with IoT sensors or PLC-OPC systems for automatic data collection.
- Built-in e-signatures and version control for compliance and traceability.
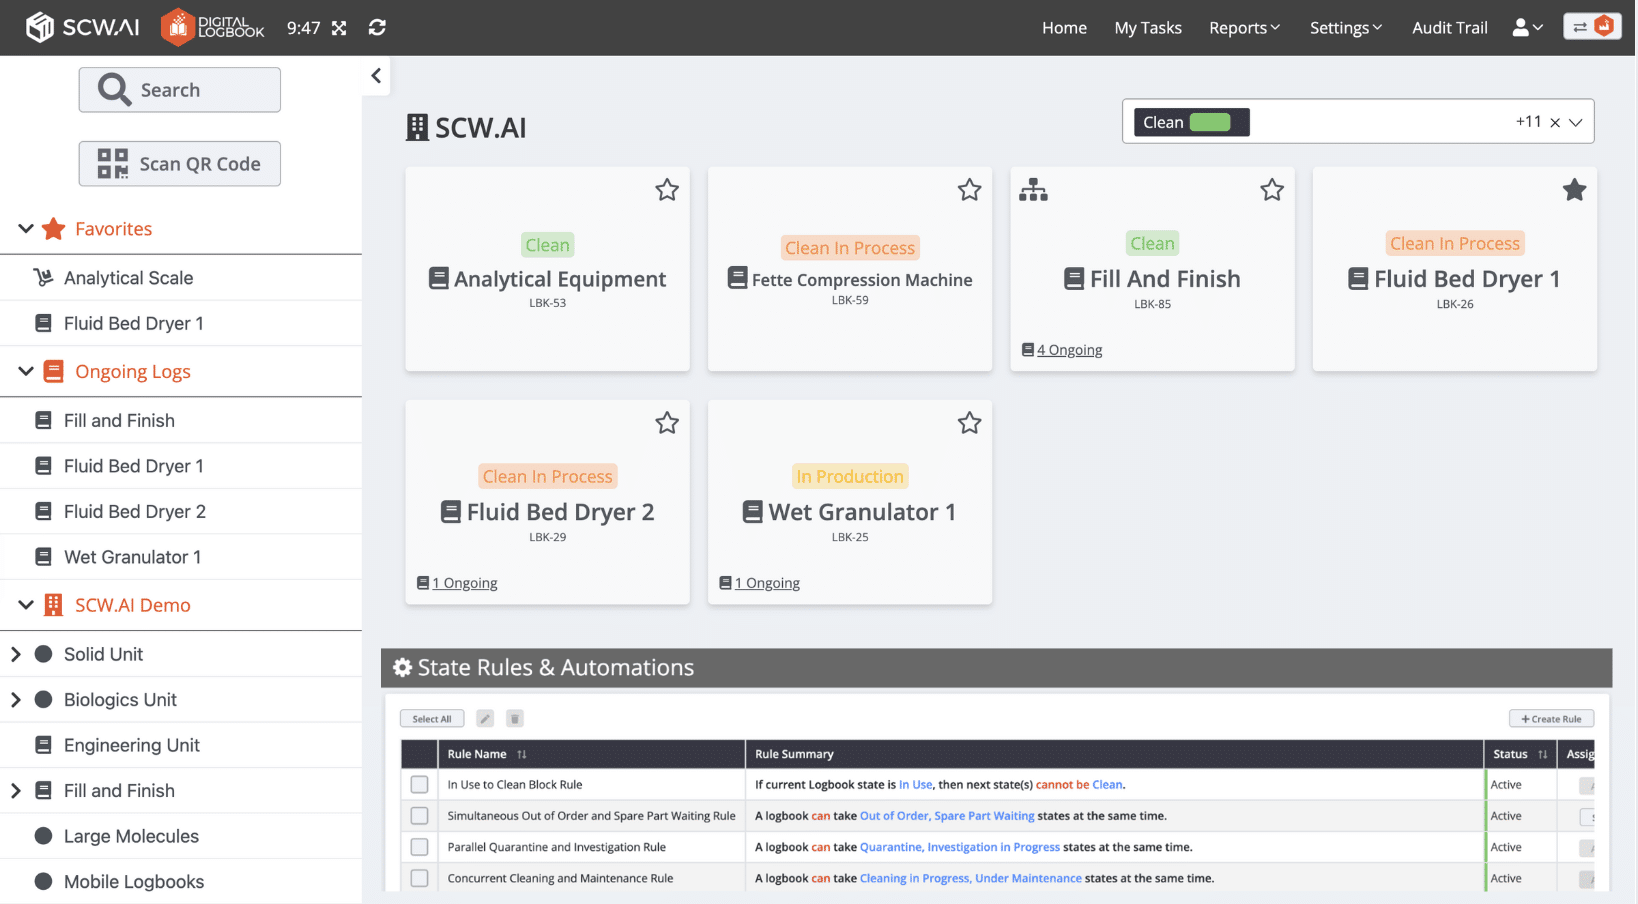
Case studies show that going paperless can reduce reporting time by up to 85% while cutting data entry errors by a similar margin.
Reducing Equipment Failures, Micro-Stops, and Speed Losses
These are often symptoms of suboptimal machine performance or insufficient preventive maintenance. In this case, the manufacturer allocated only 0.6% of ideal working time to planned maintenance—far below the recommended 2%-5%.
Manufacturers can strengthen their maintenance strategy using analytics such as Mean Time to Failure (MTTF), Mean Time to Repair (MTTR), and Mean Time Between Failures (MTBF) to schedule interventions before breakdowns occur.
For a more advanced approach, AI-driven predictive maintenance can forecast failures and optimize maintenance intervals. Such systems have proven effective—Johnson & Johnson India, for example, cut its downtime by 50% after implementing predictive models.
To explore how AI is transforming pharmaceuticals, SCW.AI offers a free white paper, “AI in Pharma: Use Cases, Success Stories, and Challenges”. You can download it by clicking the button below.

Improving the Effectiveness of Tier Meetings
In this case study, tier meetings accounted for 3% of ideal working time. While seemingly minor, such inefficiencies can cascade into wider coordination problems, especially in paper-based factory management environments.
Traditional SQCDP meetings often lack accountability. Teams repeat action items without clear ownership or follow-up. The solution is to digitize these routines using Digital SQCDP Boards that display real-time performance data across Safety, Quality, Cost, Delivery, and People pillars.
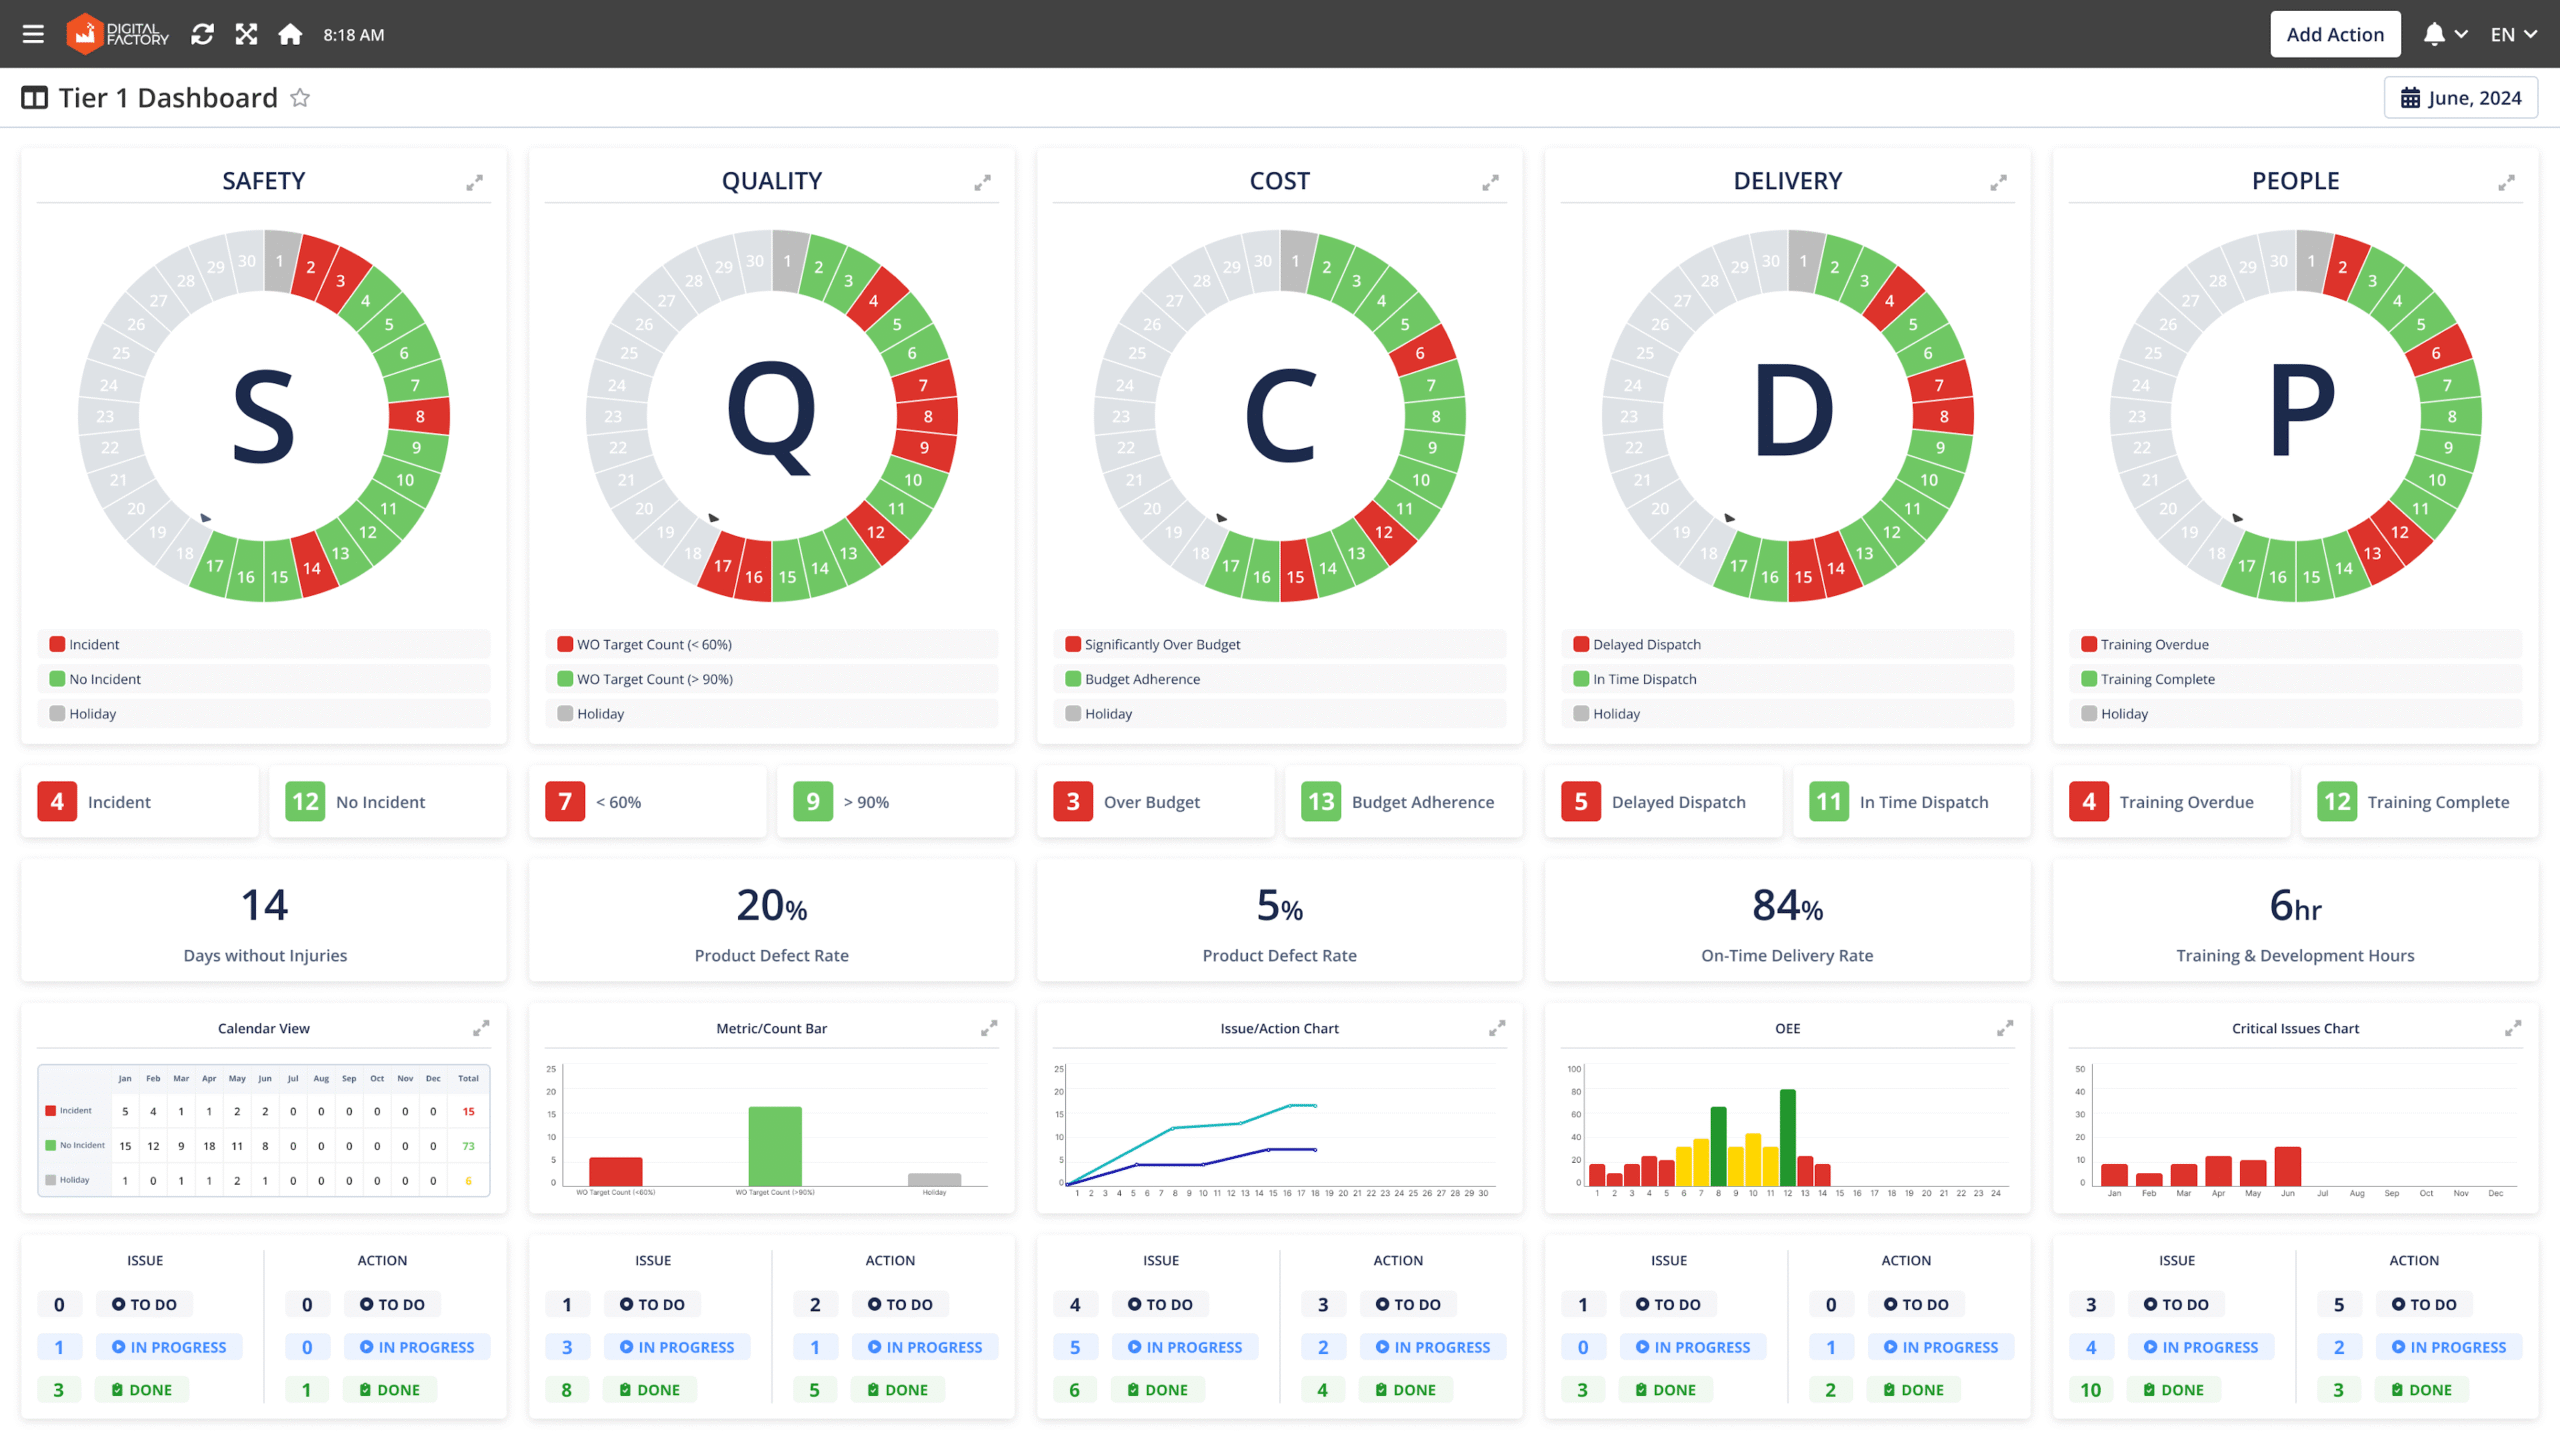
With SCW.AI’s Action Tracker, teams can:
- Assign tasks instantly with due dates and supporting information.
- Attach SOPs, checklists, videos, or digital work instructions.
- Visualize responsibilities through Digital Kamishibai Boards, ensuring every worker sees their assigned tasks and deadlines.

This not only enhances meeting effectiveness but also strengthens team engagement, accountability, and overall productivity.
Turning Insight into Action
OEE Waterfall Analysis is the foundation of scientific management in shop floors. It helps manufacturers identify what to investigate, where to act, and how to validate results through data.
By continuously tracking OEE1, OEE2, and OEE3 performance, manufacturers can see whether corrective actions deliver the expected outcomes and refine their approach over time.

For deeper guidance, SCW.AI offers a free resource: “The Pharma Manufacturer’s Complete OEE Handbook: Calculations, Benchmarks & Improvement Strategies.” This guide details how the average 37% OEE3 in pharmaceutical manufacturing can be raised to world-class levels of 60–70% using modern digital tools and data-driven optimization.
Maximize Your OEE with SCW.AI’s Digital Factory Platform
SCW.AI’s end-to-end Digital Factory Platform empowers manufacturers with complete, real-time visibility across lines, products, labor, and assets. By integrating customizable OEE1, OEE2, and OEE3 Waterfall Analysis, you can pinpoint every source of loss, uncover hidden improvement opportunities, and take data-driven actions that directly enhance productivity and throughput.
To learn more about how customizable OEE analysis can transform your operational visibility, contact SCW.AI today.
To see these capabilities in action, book a live demo of the SCW.AI Digital Factory Platform. Experience how our OEE Dashboard unifies performance data from every site, line, and shift—turning complexity into clear, actionable insights for smarter, faster manufacturing decisions.