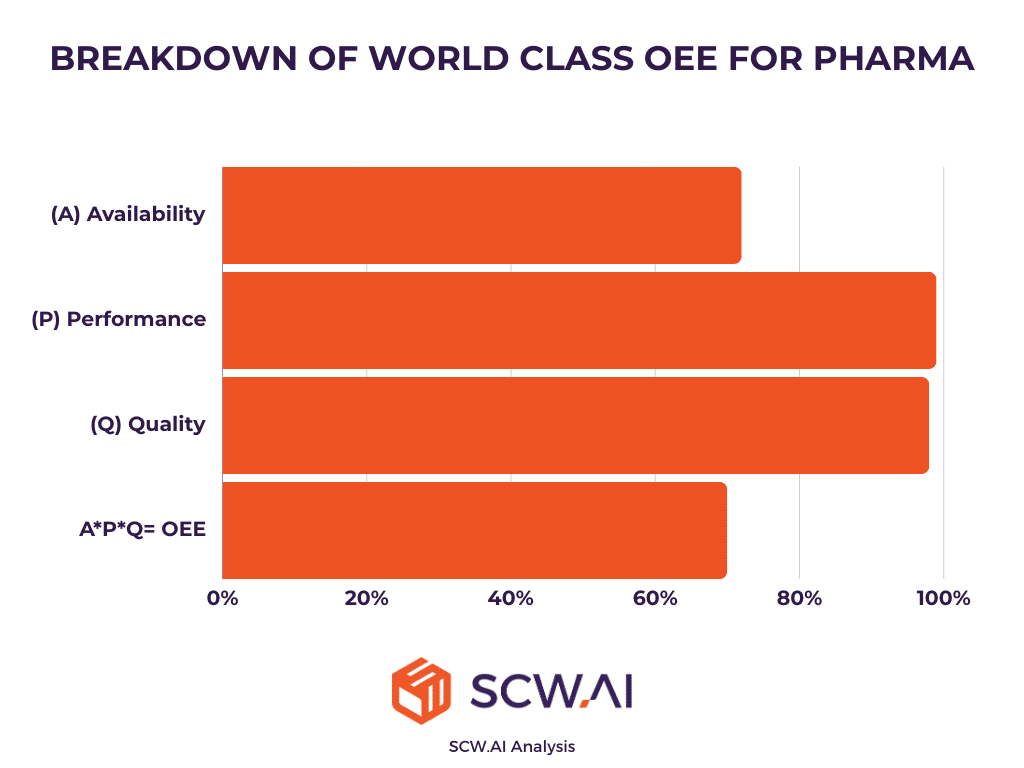
The gap in productivity and efficiency between world-class manufacturers and industry averages is often significant. For instance, a McKinsey study found that top pharmaceutical manufacturers experience just 17% of the quality deviations seen in typical operations. Similarly, our analysis of Overall Equipment Effectiveness (OEE) in pharma indicates that top-quartile performers achieve around 70%, while the industry average lags at 37%. A key factor behind this disparity is the ability to rapidly identify root causes of chronic bottlenecks.

Effective root cause analysis depends on several factors, including a factory’s digital ecosystem, company culture, and organizational structure. However, lean manufacturing visualization techniques—such as the Ishikawa Fishbone Diagram—serve as powerful tools for systematically uncovering underlying issues.
In this article, we explore the Ishikawa Fishbone Diagram in depth, covering its benefits, step-by-step creation, and real-world applications on the shop floor. Finally, we examine how Industry 4.0 technologies enhance root cause analysis by generating more comprehensive and data-driven fishbone diagrams, leading to smarter factory management.
What is Ishikawa Fishbone Diagram
The Ishikawa Fishbone Diagram, also known as a cause-and-effect diagram, is a powerful tool for visualizing root cause analysis in problem-solving. It facilitates structured brainstorming among cross-functional teams, helping them identify both primary and secondary causes of a well-defined problem. The diagram also aligns with scientific management principles, as it encourages the formulation of hypotheses about potential causes, which are then validated through data-driven analysis.
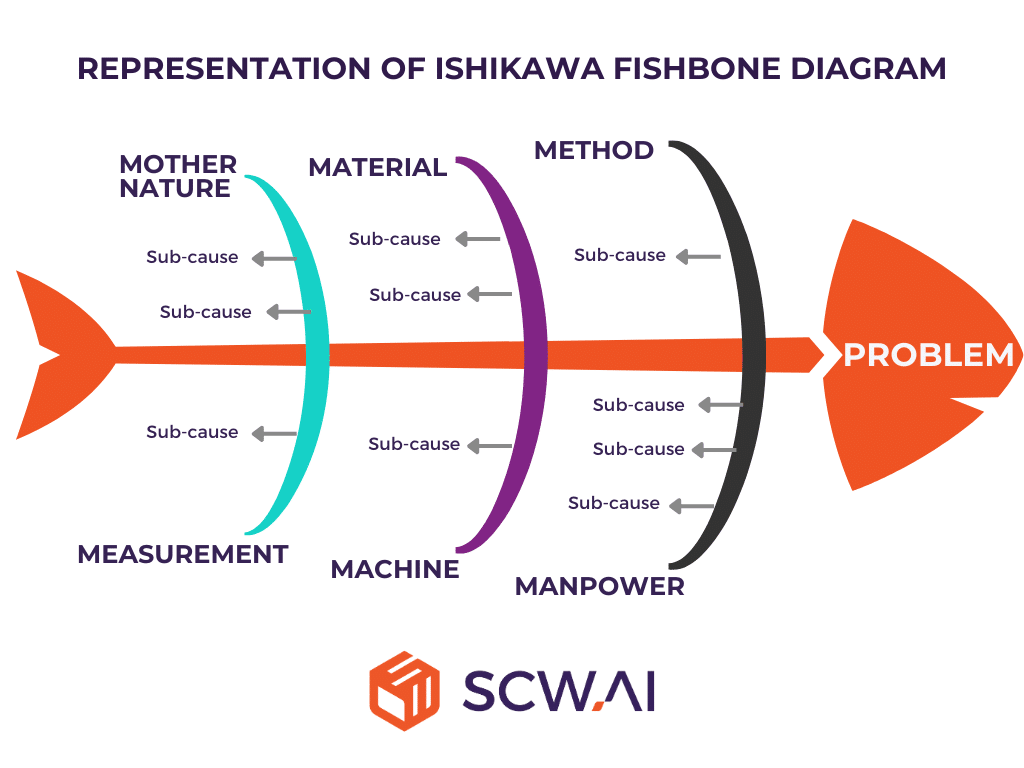
A typical fishbone diagram is drawn from right to left, with the head of the fish representing the problem statement. The large bones extending from the spine categorize the major contributing factors, such as Manpower or Machines. Beneath these, smaller bones list specific sub-causes, such as inadequate workforce training under the Manpower category.
The Ishikawa Fishbone Diagram was developed by Kaoru Ishikawa, a Japanese quality control expert. It was first introduced in the 1960s as part of Six Sigma analysis and laid the foundation for systematic problem solving and continuous improvement.
- Manpower: Issues related to workforce skills, training, and human erro
- Machines: Equipment reliability, maintenance, and performance variations
- Material: Quality, availability, and consistency of raw materials
- Mother Nature (Environment): External factors like temperature, humidity, etc.
- Method: Process inefficiencies, incorrect procedures, or standardization issues
- Measurement: Data accuracy, calibration errors, or inadequate monitoring
While originally designed for quality control, the Ishikawa Fishbone Diagram has evolved into a versatile problem-solving tool applicable across various manufacturing challenges. As we will explore in later sections, manufacturers can adapt this framework beyond traditional quality troubleshooting to enhance operational efficiency, reduce downtime, and improve overall process management.
Top 4 Benefits of Ishikawa Fishbone Diagram

1. Clear Visualization of Issues
The Ishikawa Fishbone Diagram provides a structured, visual representation of potential root causes, making it easier for teams to analyze complex problems. By mapping out causes and sub-causes, manufacturers can identify patterns and dependencies that might otherwise be overlooked.
2. Provide End-to-End Problem Analysis
By categorizing potential causes into distinct areas—such as manpower, machines, and methods—the fishbone diagram ensures a comprehensive analysis. This holistic approach helps uncover underlying systemic issues rather than just treating symptoms.
3. Enhance Collaboration Between Teams
Since the diagram encourages cross-functional brainstorming, it fosters collaboration between different departments, including production, quality control, and maintenance. This collective approach improves problem-solving efficiency and aligns teams toward a common goal.
4. Support Process Improvement
Beyond troubleshooting, the fishbone diagram serves as a continuous improvement tool by identifying weaknesses in manufacturing processes. By addressing root causes systematically, manufacturers can improve long-term outcomes.
How to Create a Ishikawa Fishbone Diagram in 5 Steps
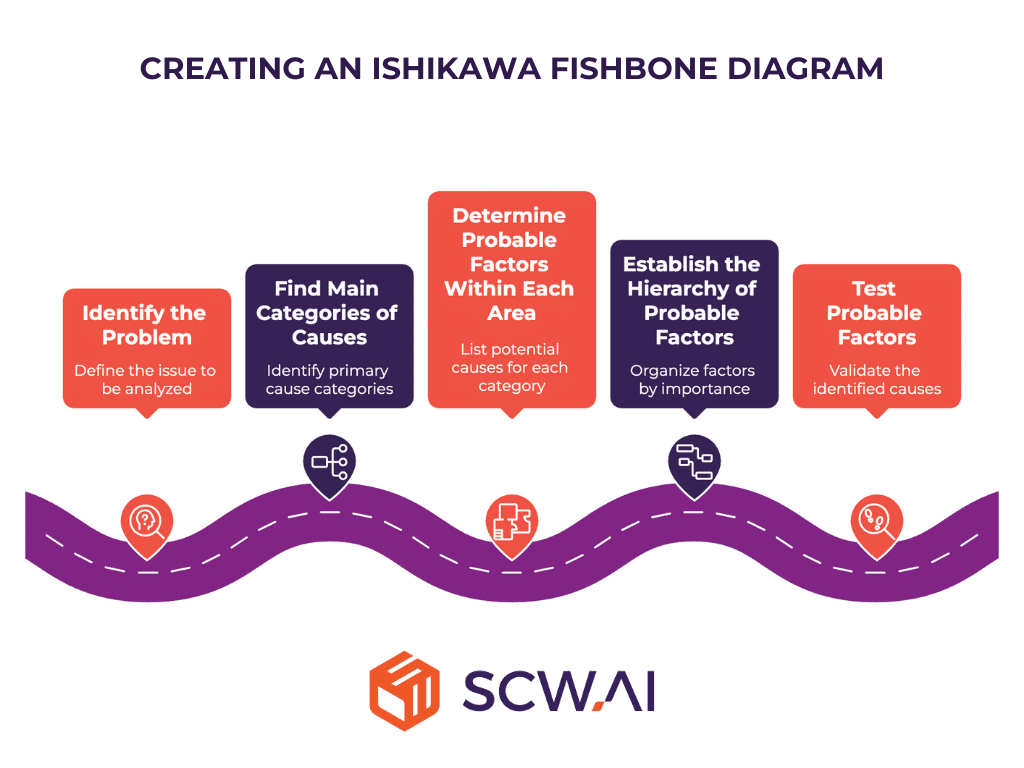
1. Identify the Problem
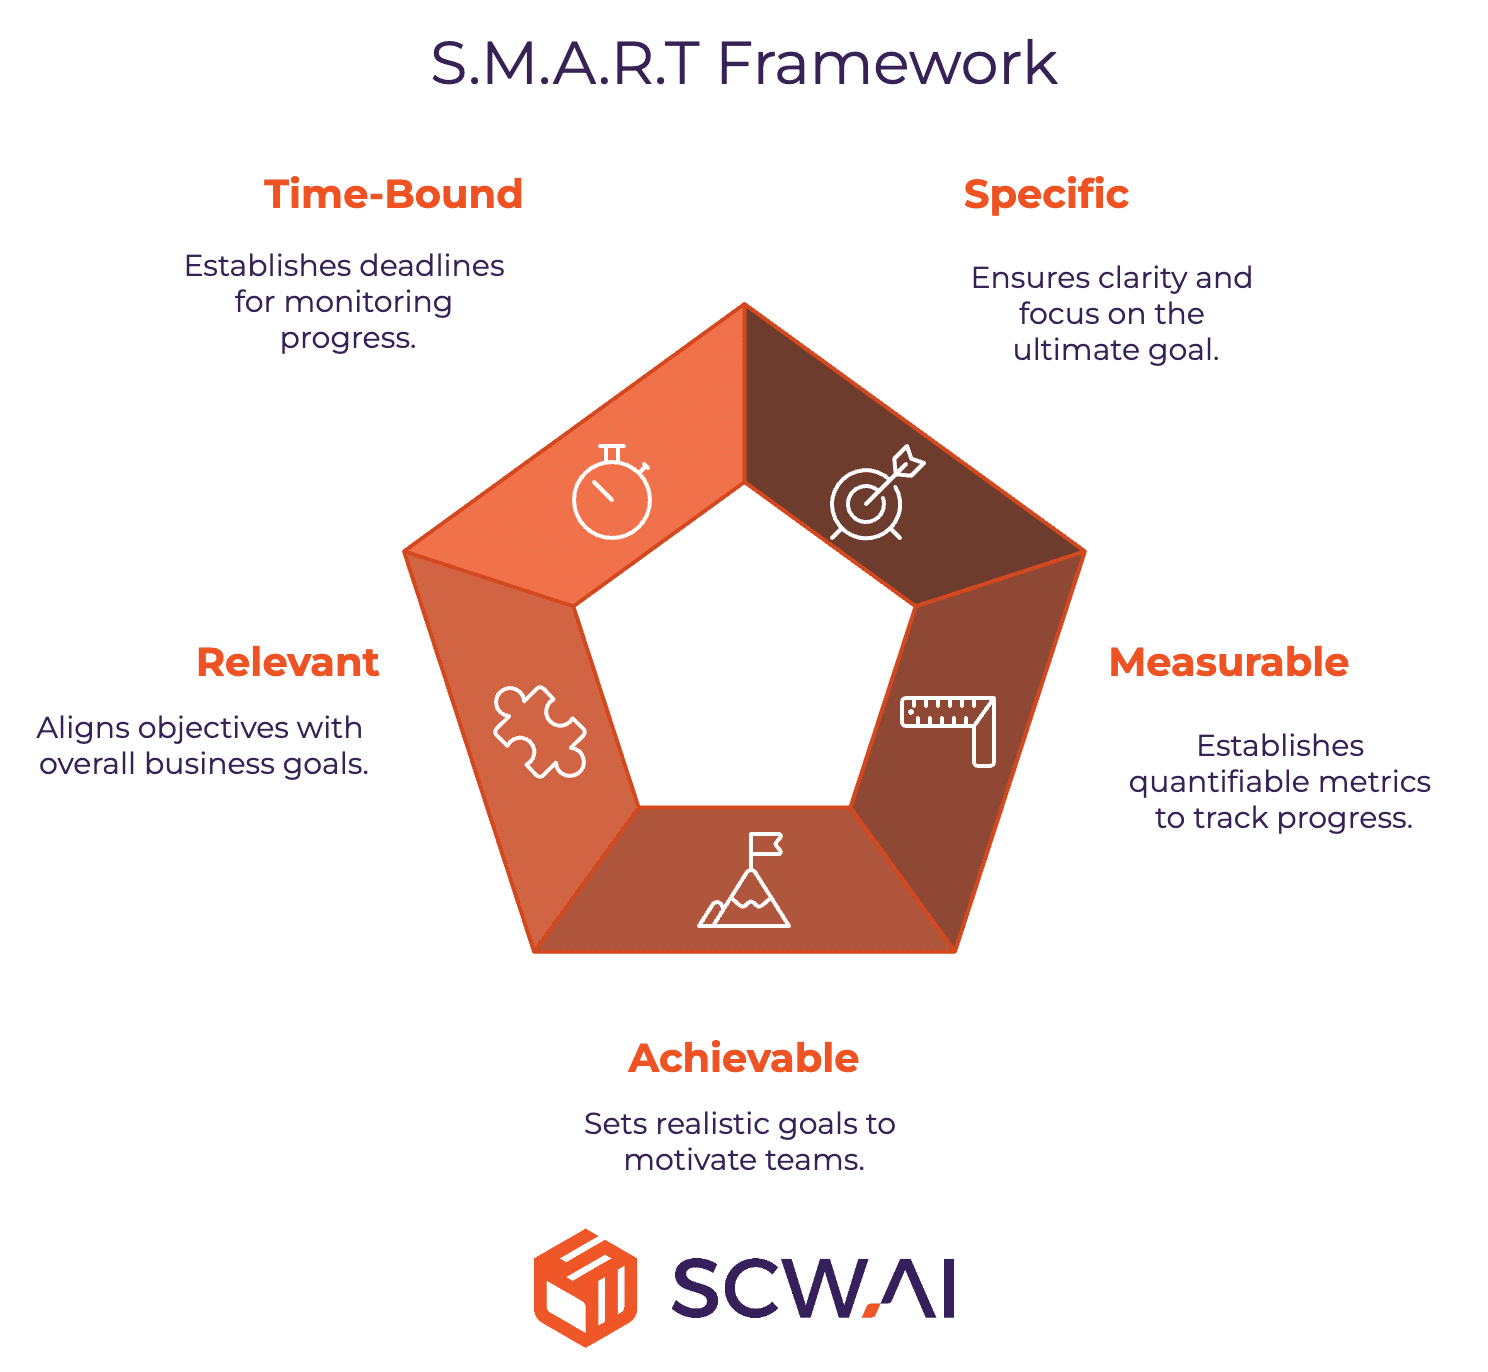
The first step is to define a clear problem statement, which serves as the head of the fishbone diagram. This statement must be specific, measurable, and relevant, ensuring that once root causes are identified, they align with S.M.A.R.T. goal setting. For example, instead of a vague issue like “high overtime costs,” a precise statement such as “3.6 hours of overtime labor per month per operator causes 15% increase in labor costs” provides a concrete basis for analysis.
2. Find Main Categories of Causes
Manufacturing issues often have multiple contributing factors, which can be independent, semi-dependent, or fully dependent on one another. For example, excessive overtime labor could result from ineffective scheduling, high cleanup variance, unplanned downtime, lack of factory automation, and more. To ensure a comprehensive root cause analysis, it is critical to brainstorm across departments and categorize causes based on their broader impact areas
3. Determine Probable Factors Within Each Area
Once the main categories of causes are established, the next step is to break them down into probable factors. Each category may have multiple sub-causes contributing to the issue. For instance, unplanned downtime may stem from:
- Aging equipment leading to frequent breakdowns
- Lack of Total Productive Maintenance (TPM) reducing machine reliability
- Inconsistent application of proactive maintenance protocols
- Delays in spare parts procurement affecting repair times
By detailing these sub-causes, manufacturers can pinpoint specific areas for intervention.
4. Establish the Hierarchy of Probable Factors
Not all causes have equal impact—some are “low-hanging fruits” that, when addressed, yield immediate improvements. Establishing a cause hierarchy allows manufacturers to prioritize corrective actions. For example, implementing TPM, where operators handle routine machine maintenance tasks like greasing and inspections, can significantly reduce unplanned downtime with minimal investment.
5. Test Probable Factors
Once probable factors are identified and prioritized, they should be tested scientifically. This is where Industry 4.0 technologies become essential. Since S.M.A.R.T. goals often tie back to key manufacturing KPIs—such as Overall Equipment Effectiveness (OEE), First Pass Yield (FPY), Takt Time, and Schedule Adherence—it is crucial to collect real-time shop floor data and visualize trends using manufacturing analytics and dashboards.
By leveraging real-time monitoring, manufacturers can validate hypotheses quickly and confirm whether the identified causes truly impact the problem statement. This data-driven verification ensures that corrective actions are based on facts rather than assumptions, leading to sustainable process improvements.

To learn about the calculation and application of over 60 manufacturing KPIs, you can download our free handbook now.
3 Real-World Ishikawa Fishbone Diagram Examples in Manufacturing
Example 1: High Scrap Rate
Problem Statement
A scrap rate of 9% exceeds quality targets, leading to increased material waste and reduced profitability.
Fishbone Diagram
- Manpower:
- Operator errors during setup
- Insufficient training on new material handling procedures
- Machines:
- Inconsistent machine calibration
- Wear and tear on cutting tools
- Material:
- Poor storage conditions causing material degradation
- Variations in raw material quality from suppliers
- Method:
- Lack of standardized tasks due to paper-based SOPs
- Absence of visual work instructions
- Measurement:
- High rework rate indicating process instability
- Frequent unplanned downtime disrupting production flow
- Mother Nature (Environment):
- Shop floor humidity exceeding thresholds, affecting material properties
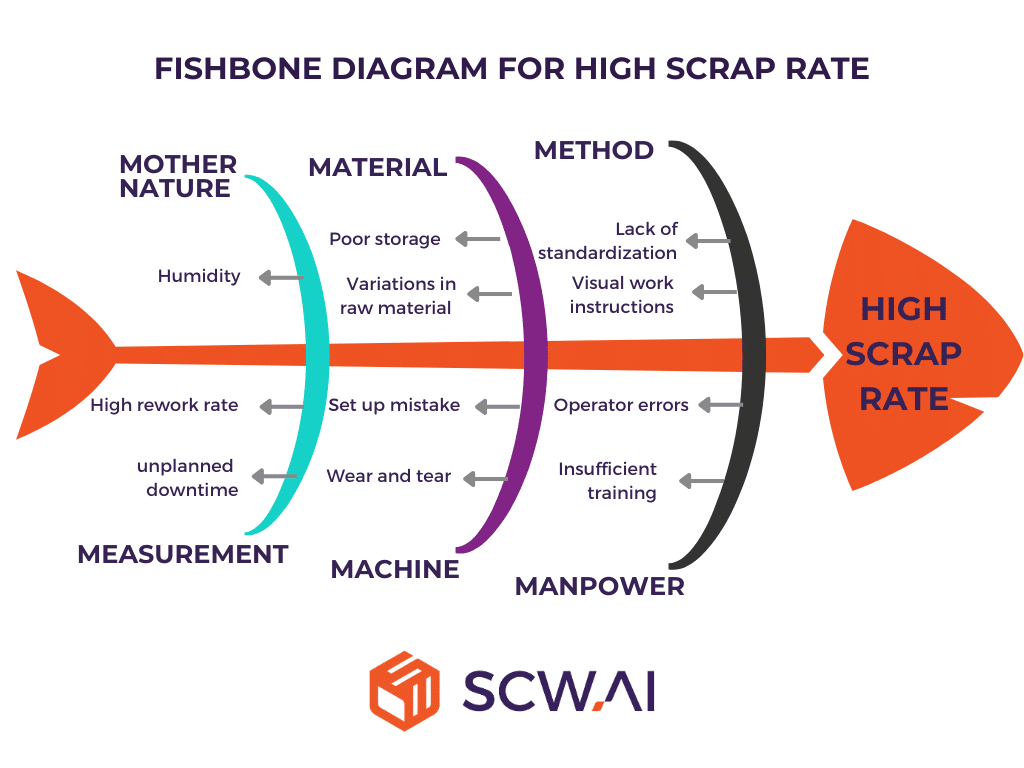
Analysis
This analysis identifies multiple root causes with 6M as a traditional Ishikawa diagram. To reduce scrap rates, manufacturers can:
- Provide targeted operator training using labor analytics
- Replace paper-based SOPs with digital forms and logbooks with videos and images attached for modern training.
- Implement predictive maintenance to improve machine reliability
- Use IoT sensors and smart HVAC systems to regulate shop floor humidity.
Example 2: Excessive Overtime Labor
Problem Statement
Operators work an average of 3.6 hours of overtime per month, resulting in a 15% increase in labor costs and reduced profitability.
Fishbone Diagram
- Scheduling/Planning:
- Non-optimal job shop scheduling
- Inaccurate demand forecasts causing staffing mismatches
- Operational Efficiency:
- Frequent unplanned downtime requiring extended shifts
- Long setup times between product changeovers
- Resource Management:
- Insufficient staffing during peak production periods
- Late material deliveries causing production delays
- Human Factors:
- Lack of cross-training leading to bottlenecks
- Limited use of labor analytics for workforce optimization
- Data/Visibility:
- Lack of real-time production tracking hindering proactive decision-making
- Lack of automation.
- External:
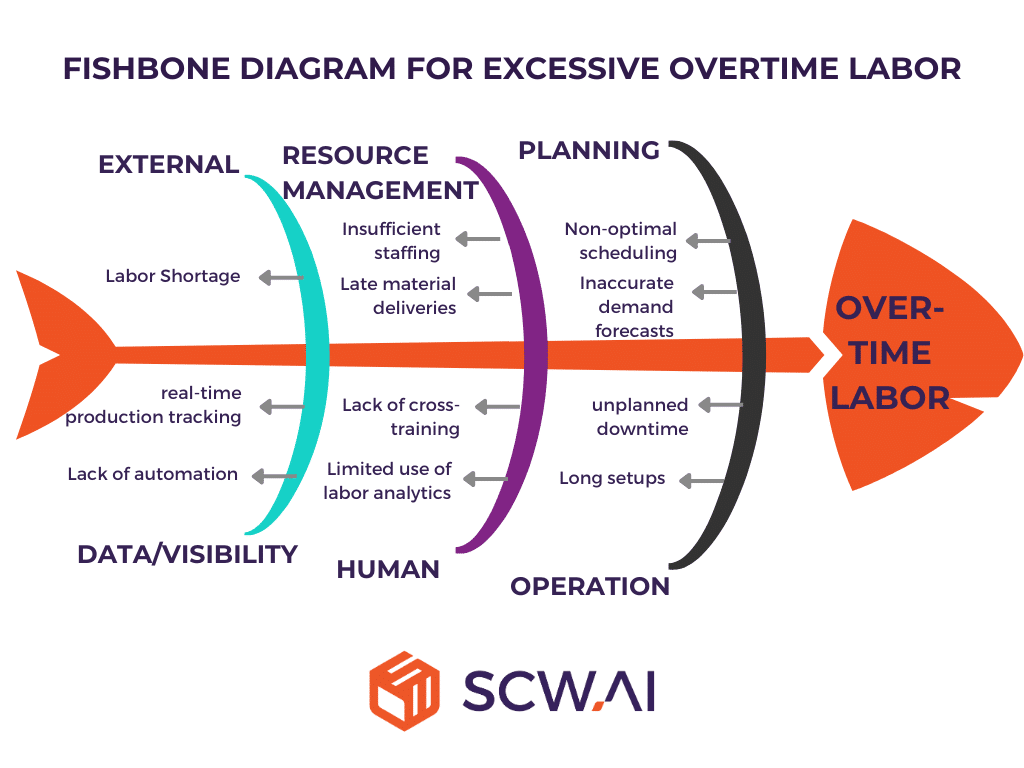
Analysis
By segmenting root causes into scheduling, efficiency, resource management, and human factors, manufacturers can take a targeted approach to reducing overtime costs:
- Optimize production scheduling and demand forecasting with AI
- Use labor analytics to train operators with high setup durations
- Leverage real-time OEE dashboards to ensure optimal line balancing.

The 3.6 hours/month overtime per worker is the current average in pharmaceutical manufacturing. If you are facing similar challenges, download our free eBook:
“7 Provocative Questions Pharmaceutical Manufacturing Leaders Should Ask to Maximize Profits.”
Example 3: High Gen Z Employee Turnover
Problem Statement
High Gen Z employee turnover (6-month average tenure) leads to increased recruitment and training costs, impacting long-term skill development.
Fishbone Diagram
- Career Development:
- Lack of mentorship and career growth opportunities
- Insufficient onboarding and training programs
- Work Environment:
- Minimal digitalization in factory processes, making work feel outdated
- Company Culture:
- Rigid, traditional work structures misaligned with Gen Z expectations
- Limited remote/hybrid work options
- Values Alignment:
- Low focus on ESG (Environmental, Social, and Governance) initiatives
- Minimal community engagement opportunities
- Feedback/Engagement:
- Lack of employee feedback mechanisms
- Environmental:
- For Gen Z sectors like tech or finance is more attractive due to digital infrastructure and hybrid work.

Analysis
Gen Z employees prioritize career growth, technology-driven environments, flexible work arrangements, and social responsibility. To reduce turnover, manufacturers can:
- Invest in digital transformation to modernize factory operations
- Prioritize ESG initiatives to align with employee values
- Offer hybrid work options for engineers using manufacturing mobile apps and cloud manufacturing tools.
Root Cause Analysis in the Age of Industry 4.0 and AI
Every Ishikawa Fishbone Diagram begins with a well-defined, specific, and measurable problem statement. To formulate such statements effectively, manufacturers need high shop floor visibility—ensuring that performance is tracked in real time, KPIs are continuously monitored, and underperforming metrics trigger immediate alerts for swift corrective action.
Beyond identifying problems, fishbone diagrams also facilitate the formulation of hypotheses about potential root causes. These hypotheses must be tested and validated, and this is where Industry 4.0 technologies play a crucial role. With digital transformation, manufacturers can measure the impact of operational changes almost instantaneously, creating a data-driven environment for continuous improvement.
This section explores how smart factory technologies enhance root cause analysis, making fishbone diagrams more accurate, actionable, and effective.
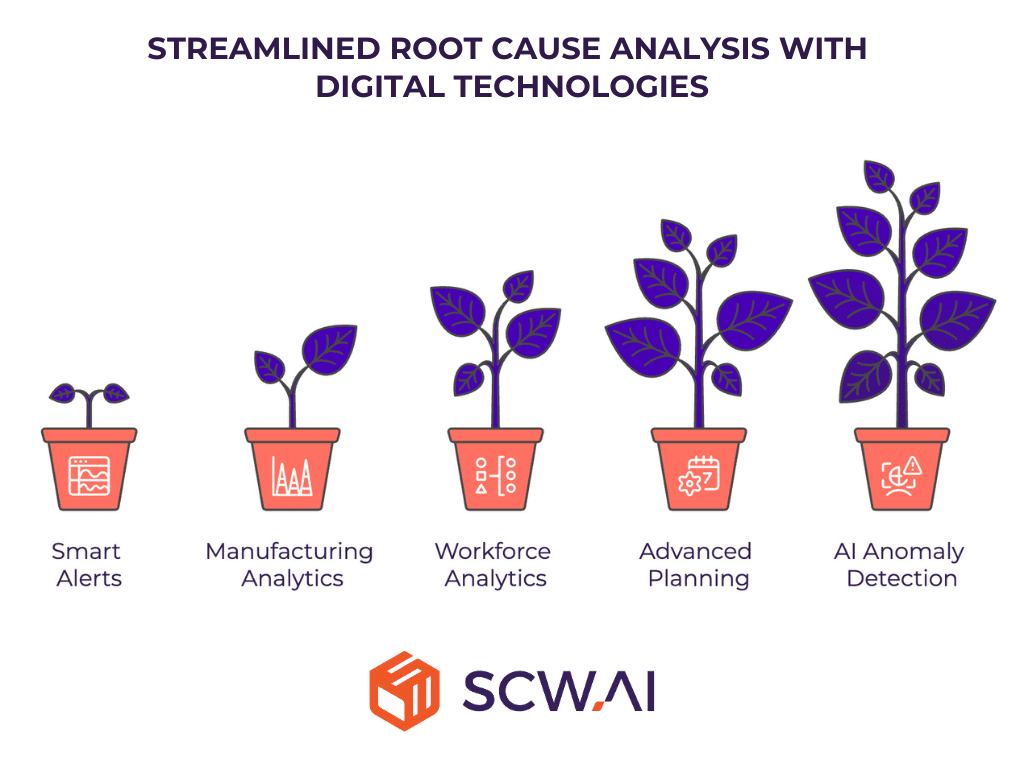
Monitor Your Factory in Real Time with Smart Alerts and Notifications
Real-time alerts and notifications allow manufacturers to detect issues the moment they occur. For instance, an unplanned downtime event can automatically trigger an alert, enabling immediate intervention. This rapid issue identification is the first step in root cause analysis, often initiating a 5 Whys procedure to determine the fundamental cause of the disruption.
Harnessing Manufacturing Analytics for Smarter Problem-Solving
Manufacturing analytics provide an automated, data-driven approach to troubleshooting by displaying historical shop floor, machine, and production data in an intuitive format. Instead of relying on manual investigations, manufacturers can leverage analytics tools that automatically trigger structured root cause analysis methods like 5 Whys.
For example, reviewing an SQCDP (Safety, Quality, Cost, Delivery, People) dashboard might reveal poor delivery performance for the current month.
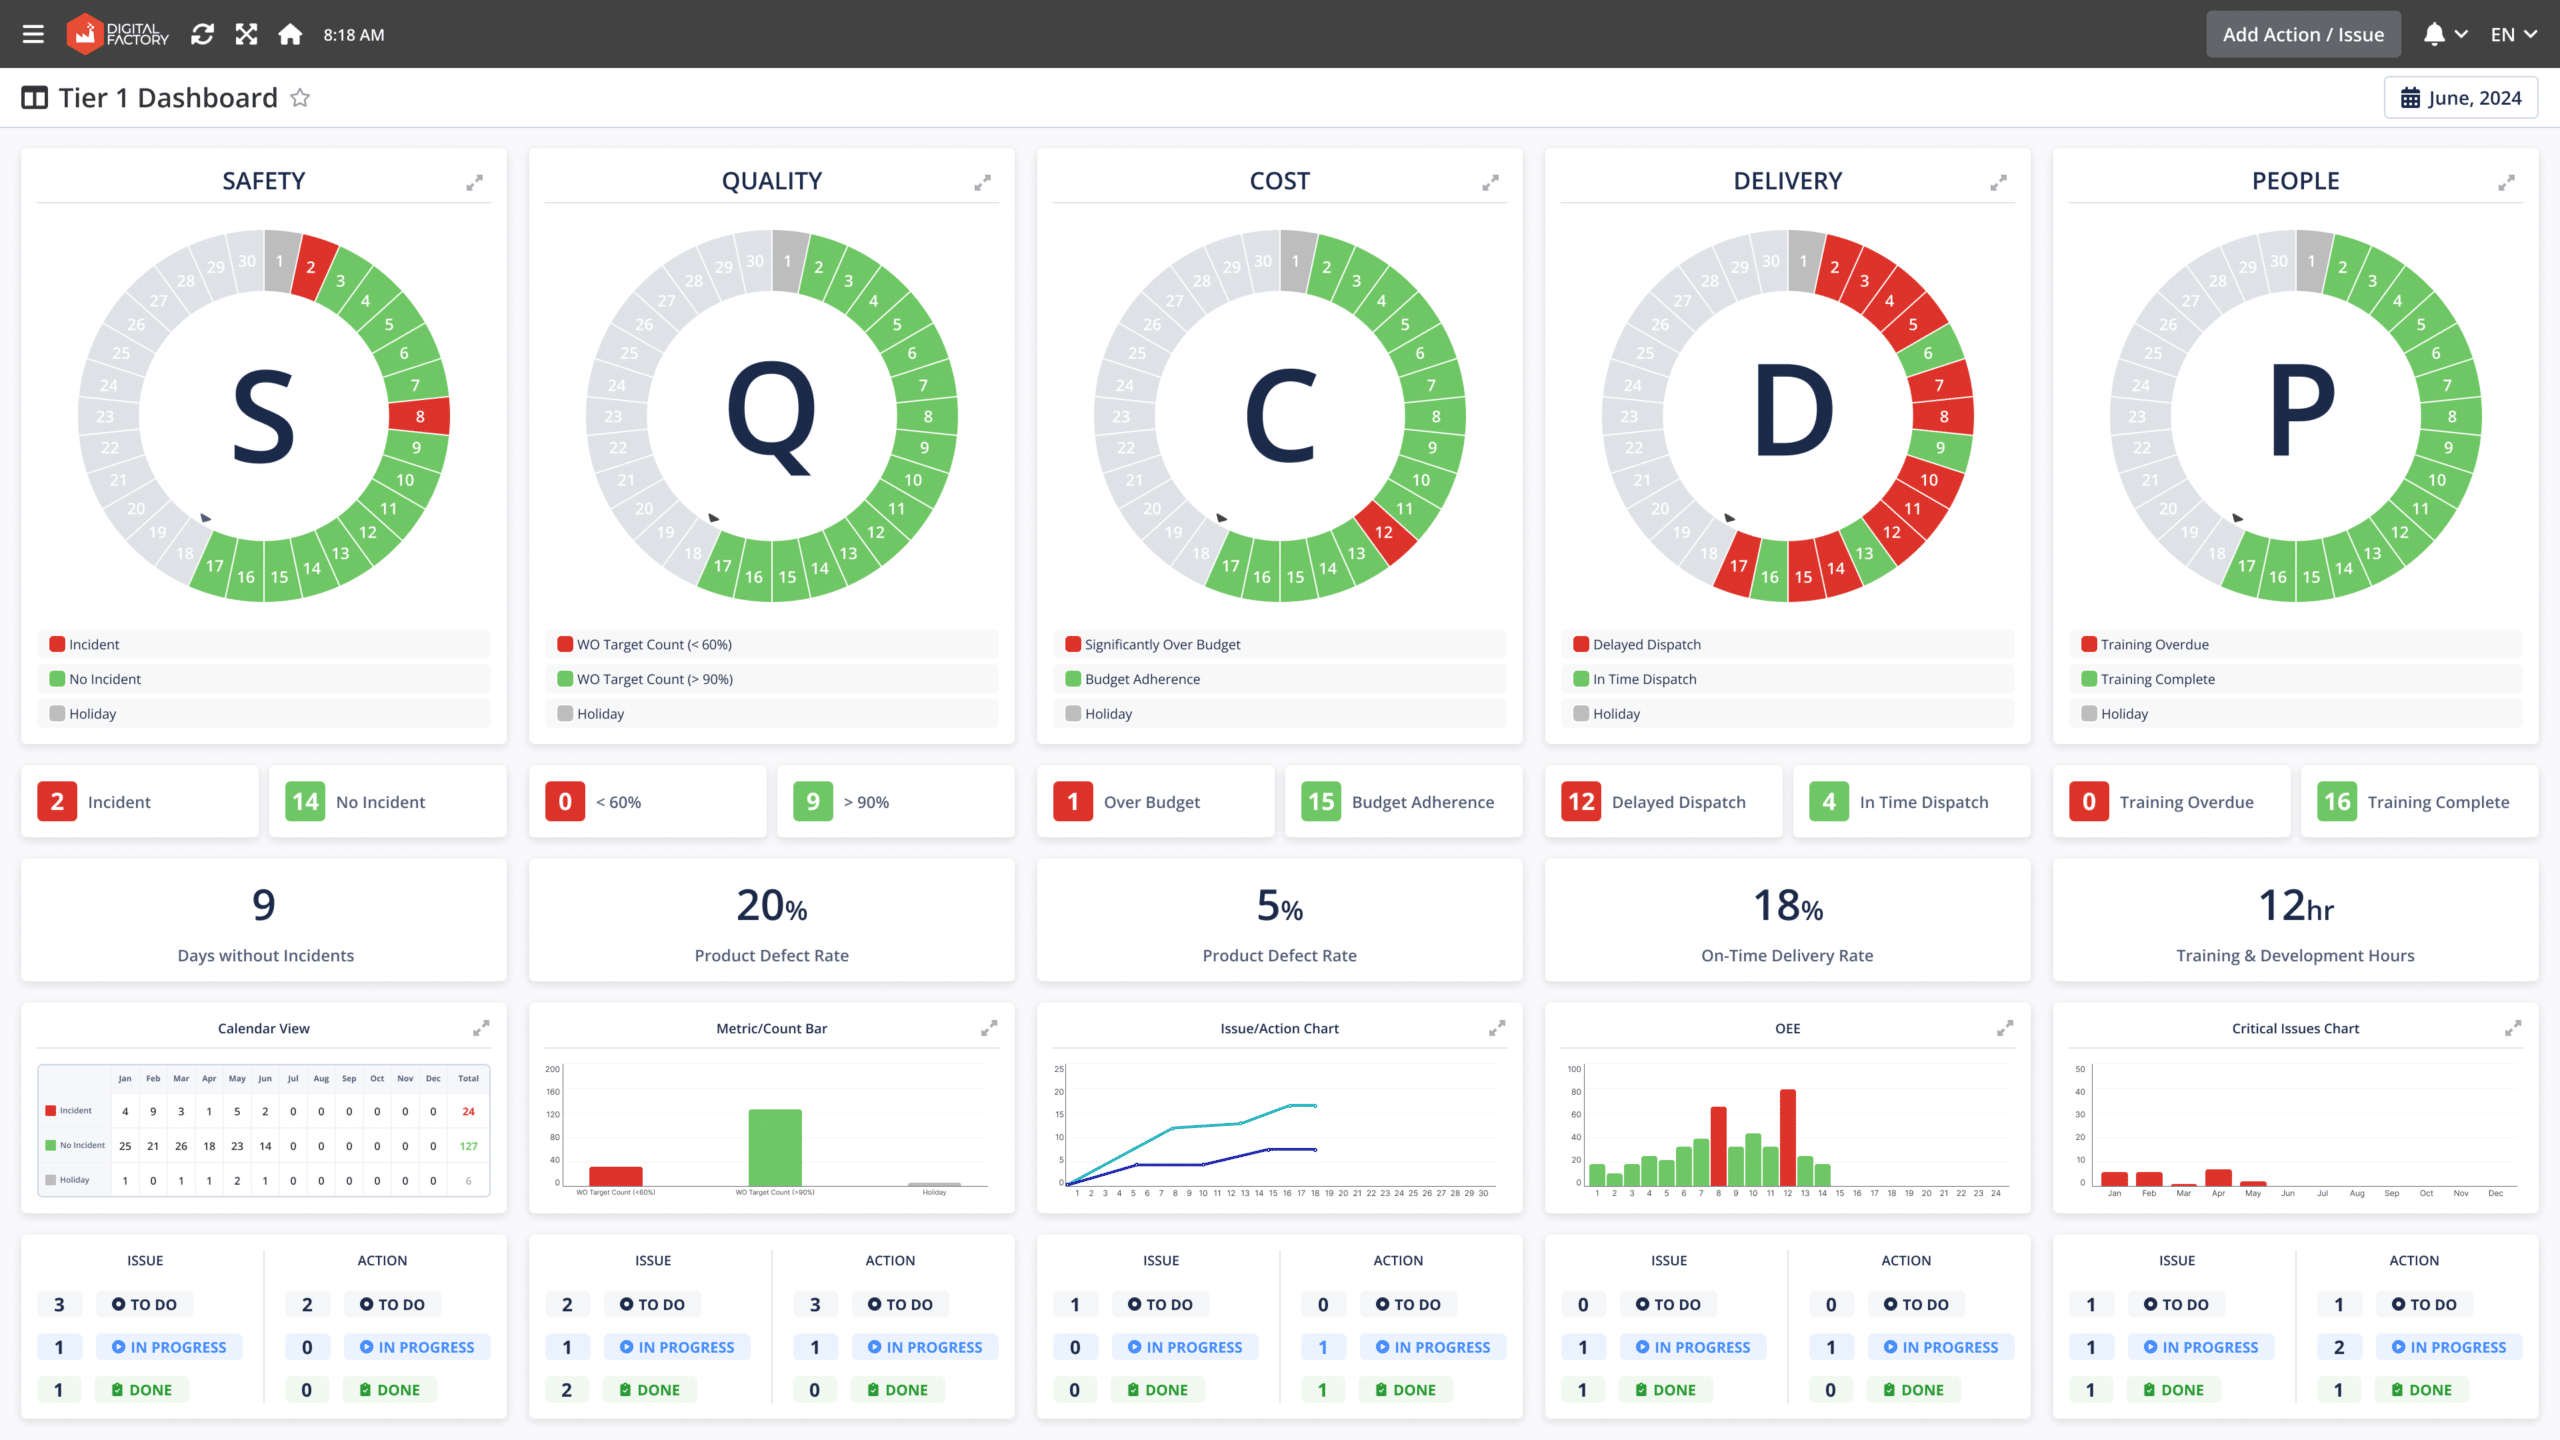
Further analysis through an OEE Waterfall Chart could indicate that excessive time is lost due to frequent line cleanups.
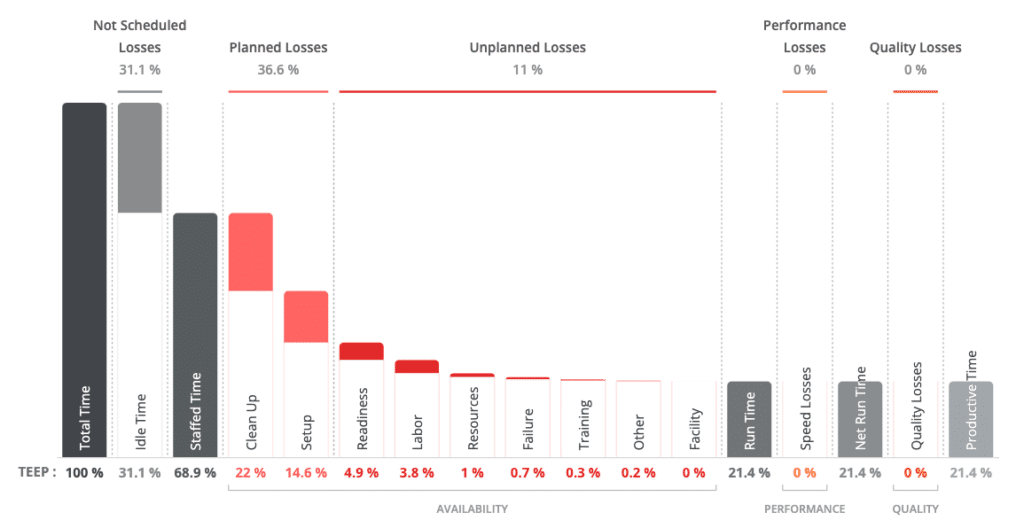
Drilling down into a Changeover Analysis might then show that major cleanups regularly exceed target durations.
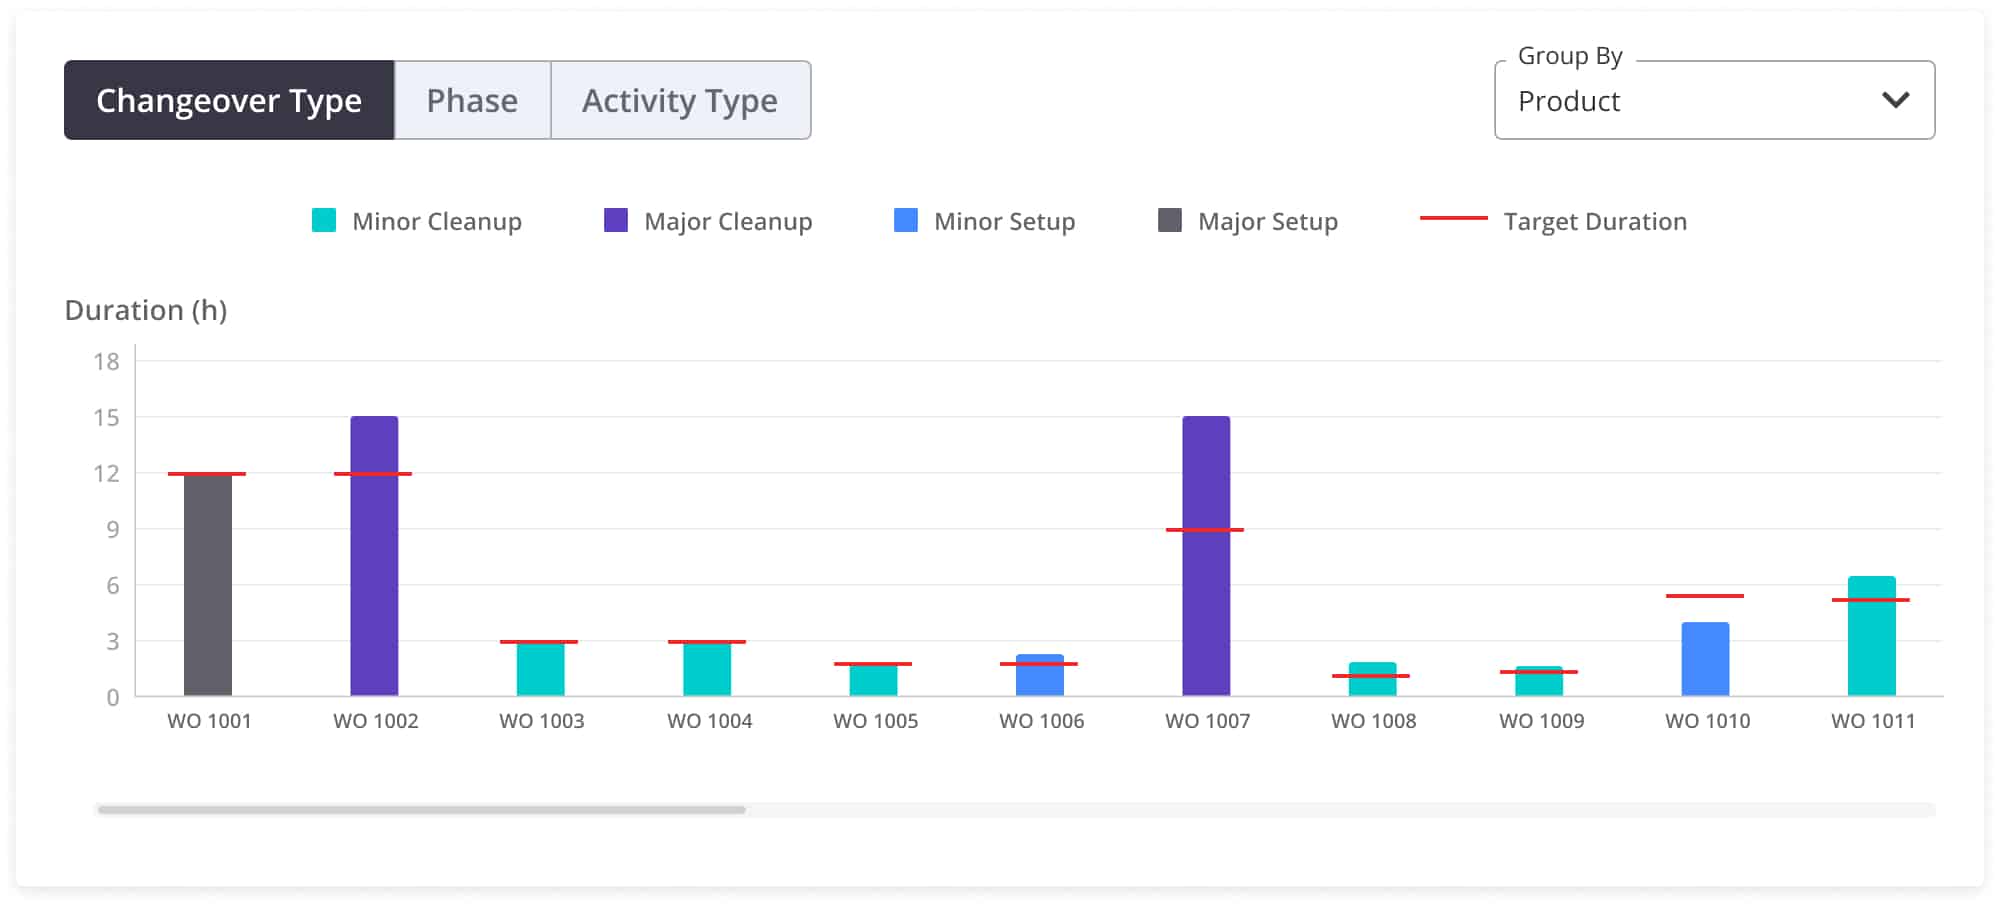
With this insight, manufacturers can:
- Provide targeted operator training to improve cleanup efficiency
- Refine production scheduling to minimize the frequency of major cleanup
Identifying Workforce Bottlenecks with Labor Analytics
According to our case studies, 30% to 50% of paid labor hours in manufacturing are non-productive shadow hours, often leading to overtime costs, employee burnout, and high turnover rates—creating a vicious cycle of skill gaps.
By tracking labor activities and using analytics, manufacturers can identify inefficiencies and address them through targeted training and task reallocation.
For instance, if labor data shows that a specific worker consistently exceeds target times for cleanup and setup tasks but performs well during production runs, a manufacturer might:
- Reallocate tasks to focus on the worker’s strengths
- Provide personalized training to improve their cleanup and setup efficiency

Staying on Schedule with Advanced Planning and Scheduling Tools
Advanced Planning and Scheduling (APS) systems or production scheduling software help manufacturers track KPIs such as schedule adherence, schedule compliance, and schedule attainment, providing crucial insights for root cause analysis.
For example, if schedule attainment is consistently higher than schedule adherence, it could indicate that the factory is productive but frequently disrupted by last-minute work orders.

This suggests a need for:
- Better production planning to reduce last-minute scheduling changes
- Stronger alignment between planning and production teams
AI-Powered Anomaly Detection for Optimizing Batch Quality
By analyzing historical production data, AI-driven anomaly detection can identify optimal machine configuration parameters. If an operator sets a machine outside these standard parameters, the system immediately triggers an alert, notifying managers of a non-standard machine setup before it impacts batch quality.
This approach offers several benefits:
- Prevents operator errors before they cause defects or inefficiencies
- Reduces process variability, ensuring consistent batch quality
- Highlights training gaps, allowing manufacturers to introduce video-based or interactive training materials for complex setup tasks. Such videos can be created easily via utilizing generative AI and attached on paperless quality solutions.

If you operate in the pharmaceutical industry and are wondering how AI will generate an additional $ 250 billion in value for the industry by 2030, download our free white paper, ‘AI in Pharma: Use Cases, Success Stories, and Challenges,’ now.
Streamline Root Cause Analysis with SCW.AI
SCW.AI empowers manufacturers to conduct fast, data-driven root cause analysis, helping them reduce costs, increase throughput, and enhance quality. Our Digital Factory Platform provides an end-to-end transformation for shop floors, enabling real-time monitoring and actionable insights.
With SCW.AI’s Digital Factory, brainstorming sessions for Ishikawa Fishbone Diagram creation become more data-driven, ensuring that identified root causes are realistic and immediately testable. By integrating real-time analytics, manufacturers can validate hypotheses quickly, leading to faster issue resolution and continuous process improvement.
If you want to see how SCW.AI can optimize your factory’s problem-solving process or need more information on Ishikawa diagrams, contact us today.
Book a demo now to explore the Digital Factory Platform and future of root cause analysis in action.