In 2023, technology vendors played an indispensable role as partners for manufacturers, with approximately 60% of them collaborating with providers to deploy industry 4.0 technologies. Undoubtedly, to increase visibility, agility, and automation for enhanced profits, manufacturers will continue to engage with technology vendors in 2024 and beyond.
As highlighted by Gartner, the real challenge lies in finding the right technology vendor that assists manufacturers in implementing a successful digital transformation. Gartner introduces criteria to evaluate vendors, including functional tool matching, scalability, cost, and support and services provided to partners.
SCW.AI sets itself apart by offering exceptional support and services to its customers. We showcase our customer-centric approach through our personalized reporting solutions, crafting dashboards meticulously tailored to meet the distinct requirements of each individual client. In this article, we will delve into the definition of custom reports and elucidate their benefits for our customers. Subsequently, we will present three case studies of our custom reports from varying clients to illustrate how such reports effectively address the business problems of our customers.

SCW.AI’s Custom Reports
Custom reports are personalized dashboards that we create in collaboration with our customers to present their data in a tailored and more insightful manner. Leveraging Metabase for data visualization, these reports can be accessed on desktops and our mobile app. We also provide the added convenience of delivering customer reports at daily, weekly, or monthly intervals, showcasing their progress towards achieving their goals. Furthermore, customers have the flexibility to review these reports at any time they wish, similar to any other report on our Digital Factory Platform.
To date, SCW.AI has crafted over 200 custom reports, which are typically delivered in a short period of time. This quick turnaround allows us to promptly address our customers’ requests and generate reports that cater to their unique business requirements.
Why Do We Generate Custom Reports
SCW.AI’s primary objective is to enhance manufacturing efficiency by facilitating industry 4.0 transformation, making goods more affordable and accessible worldwide. In alignment with this goal, we create custom reports to support manufacturers in their digital lean activities, offering the following benefits:
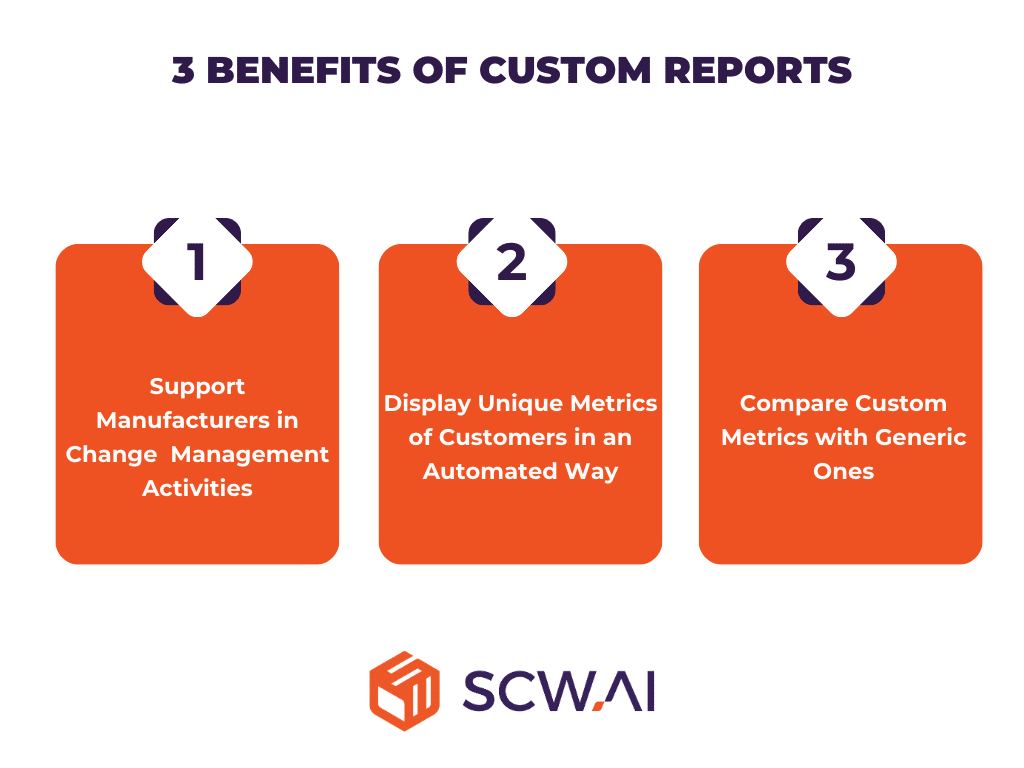
1. Support Manufacturers in Change Management Activities
Many manufacturers, prior to adopting digitization, relied on reports typically in the form of Excel sheets that had been in use for an extended period. In many cases, the staff had become accustomed to these reports and expressed the desire for a similar automated dashboard that could be updated with real-time data.
By creating automated versions of our clients’ existing reports, we streamline the change management process, facilitating a more seamless digital transformation for manufacturers. This not only enhances efficiency but also ensures a smoother transition as organizations embrace automation in their reporting systems.
2. Display Unique Metrics of Customers in an Automated Way
As expected, the Digital Factory Platform reports are structured around widely-recognized Key Performance Indicators (KPIs) that have received endorsement from industry leaders. We meticulously follow established standards and employ universally accepted definitions when calculating metrics such as Overall Equipment Effectiveness (OEE), On-Time In-Full (OTIF), Mean Time To Failure (MTTF), and various other key performance indicators.
However, manufacturers sometimes create their own metrics or interpret a generic metric differently, believing it better reflects their performance. In such cases, we generate custom reports for customers that display their unique KPIs. This ensures that our customers can compare the same metrics they utilized before collaborating with us.
This collaborative approach occasionally prompts us to reinterpret generic metrics, aiming for a more beneficial industry-wide perspective. For example, our Daily Production Performance Report shares similarities with takt time, as both offer insights into the production speed necessary to synchronize with the production schedule. However, takt time represents an average, dictating a fixed production rate of, for instance, 2 pieces per minute. In contrast, the shop floor is a dynamic environment, where production speed can undergo frequent fluctuations. In recognition of this dynamic nature, our report takes into account the variability in production speed, providing a nuanced perspective that aligns more closely with the real-time dynamics of the manufacturing process.

3. Compare Custom Metrics with Generic Ones
When a client requests custom reports from us, they often also utilize the reports of the Digital Factory Platform. In such cases, they can seamlessly check both generic and tailored KPIs in an automated manner. This approach provides deeper insights into bottlenecks and potential business opportunities.
3 Case Studies of Custom Reports
Exploring real-life examples of custom reports is essential for providing readers with a tangible understanding of the practical applications and advantages associated with these reports. Therefore, we have curated three case studies that illustrate the diverse use cases and substantial benefits of our custom reports:
1. Custom Report Cuts Changeover Variance by 60% in Half a Year
One of our clients experienced prolonged changeover durations which significantly reduced their productive time. To closely monitor the changeover process, the client requested a custom report that provided both general and in-depth information on changeover durations.
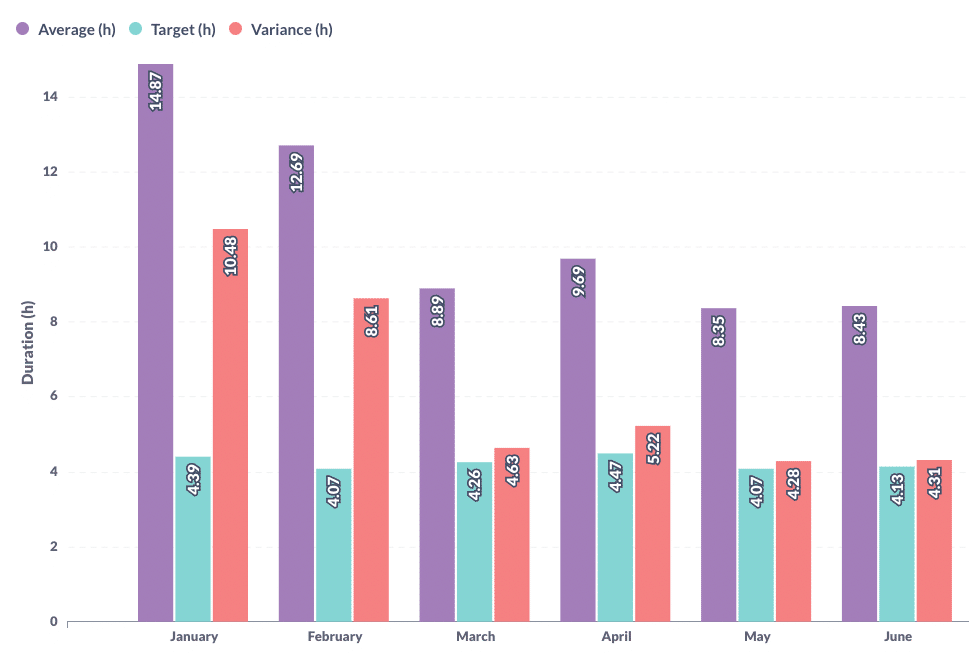
Initially, we segmented changeovers into two components: clean-up and set-up. Then we assigned durations for their targeted clean-up and set-up processes which provided targeted average changeover period. We also included columns for actual changeover duration, and variance, indicating information on the actual changeover period and the distance to the target, with reddish colors.
Furthermore, we provided a more detailed report where executives could examine changeover durations work order by work order and product type by product type. By examining the overall picture first and delving deeper on a granular basis, the client discovered two main insights.
Firstly, they were able to reduce the number of major clean-ups and set-ups by replacing them with more minor changeovers. Secondly, the client identified that certain setups were slow due to the inadequate experience of workers, highlighting the need for training.
Through targeted training and an increased number of minor changeovers, our client successfully reduced the average changeover variance from 10 hours to 4, approaching their goal of achieving zero variance.

AI driven advanced planning and scheduling systems can be a game changer for replacing major changeovers with minor ones. To learn more regarding APS systems you can read our In-Depth Guide to Advanced Planning and Scheduling blog post.
2. Customized OEE Metric Calculation for Pharma Company
Planned downtimes for pharmaceutical manufacturers are often longer compared to other industries, primarily due to extended cleaning periods mandated by regulations such as cGMP. Therefore, as demonstrated in our OEE benchmarking analysis, pharmaceutical companies typically experience lower OEE compared to other industries. World-class OEE for the pharmaceutical sector is expected to be around 70, in contrast to the higher benchmark of 85 seen in other industries.
For this reason, one of our clients in the pharmaceutical business asked us to create a customized OEE report. The manufacturer requested an OEE report that excludes planned downtime, arguing that their availability must be poor due to inevitable lengthy cleaning procedures. The majority of cleanup was used to establish a target OEE. Also, they had actual OEE calculated by ignoring planned downtime. If the production effectiveness was above target, as the below chart surpasses 100. If it stayed below 100, there could be a bottleneck, which should be further investigated by the team in order to identify strategies for lowering unscheduled downtime, micro-stops, and quality losses.

If you are aiming to minimize unplanned downtime, our blog post on the Top 5 AI Use Cases in Manufacturing offers valuable insights. It covers strategies such as increasing equipment lifespan through machine learning-driven predictive maintenance and leveraging digital twins for visual machine inspections.
3. Weekly Schedule Adherence Reports Highlight Manufacturing Scheduling Inefficiencies
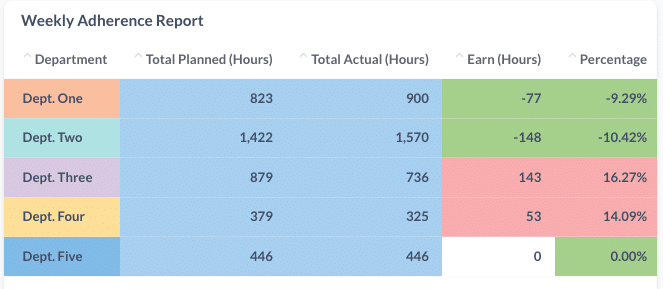
One of our customers experienced deviations from their scheduled activities. Some departments completed tasks with approximately a 10% delay compared to the planned time, while others finished work orders up to 15% earlier than scheduled.
The lack of customer visibility made it challenging to determine which departments had the capacity to produce more but were underestimated by the scheduling team. Additionally, it was unclear whether departments frequently completing work orders with a time delta were facing shop floor inefficiencies or dealing with unrealistic scheduling from the planning team.
To identify bottlenecks, our client requested a weekly custom report for their scheduling adherence. The report compared planned and actual durations for activities in each department, illustrating the time earned in both hours and percentage. By integrating this information with KPIs such as the OEE Waterfall Report, our customer pinpointed the root cause of deviations from good schedule adherence (90%-100%). It was revealed that for some departments, incorrect master data led the scheduling team to overestimate scheduled time.
For certain departments, unplanned downtime and speed losses were identified as the root cause of low schedule adherence, prompting the manufacturer to take action to minimize availability and performance losses.
About SCW.AI
SCW.AI specializes in designing cloud-based visibility, productivity, and agility solutions exclusively for the manufacturing industry. These solutions are consolidated into a single platform known as Digital Factory. Within this platform, manufacturers can leverage AI and IoT capabilities to perform various tasks and monitor their end-to-end production in real time. This includes tracking assets, people, and the environment through automated real-time dashboards and reports.
As emphasized in this article, SCW.AI prioritizes the needs and satisfaction of its clients. In cases where the standard reports of the Digital Factory Platform may not suffice for your specific operations, we offer the creation of custom reports tailored to your factory’s unique needs. Overall, we aim to reduce your cost of goods sold and enhance profitability. To find out more information regarding Digital Factory Platform, book a demo now!
If you have further questions regarding our custom report policy or customer success team you can reach us.
